| (£ in Million) | 2026 | 2025 | 2024 | 2023 | 2022 |
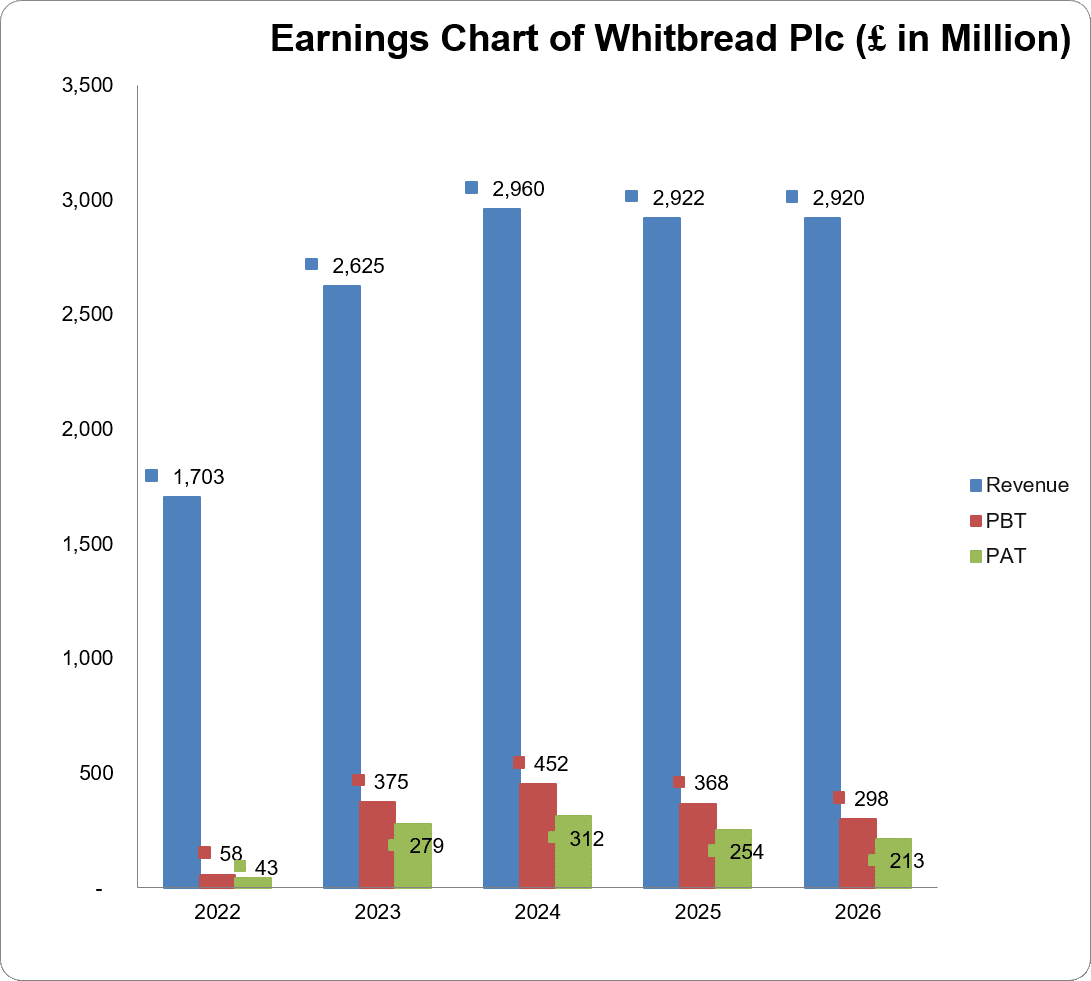
| Turnover | 2,920 | 2,922 | 2,960 | 2,625 | 1,703 |
| Year-on-Year Change | -0.1% | -1.3% | 12.8% | 54.1% | 189.0% |
| Operating Profit | 464 | 514 | 565 | 505 | 227 |
| Year-on-Year Change | -9.7% | -9.0% | 11.8% | 122.2% | -127.1% |
| EBITDA | 890 | 916 | 948 | 851 | 554 |
| Year-on-Year Change | -2.8% | -3.4% | 11.5% | 53.5% | -202.8% |
| PBT | 298 | 368 | 452 | 375 | 58 |
| Year-on-Year Change | -18.8% | -18.6% | 20.5% | 544.2% | -105.8% |
| PAT | 213 | 254 | 312 | 279 | 43 |
| Year-on-Year Change | -16.1% | -18.7% | 11.9% | 556.0% | -104.7% |
| Total Assets | 9,569 | 9,905 | 9,521 | 9,943 | 9,567 |
| Year-on-Year Change | -3.4% | 4.0% | -4.2% | 3.9% | 8.7% |
| Net Current Assets | -502 | -246 | -33 | 483 | 549 |
| Year-on-Year Change | 104.1% | 640.7% | -106.9% | -12.0% | -74.2% |
| Total Equity | 3,136 | 3,335 | 3,519 | 4,111 | 4,119 |
| Year-on-Year Change | -5.9% | -5.3% | -14.4% | -0.2% | 7.4% |
| Capital Expenditure | 675 | 486 | 509 | 519 | 222 |
| Year-on-Year Change | 39.0% | -4.4% | -2.0% | 134.2% | -2.9% |
| Funds from Operations | 753 | 762 | 878 | 800 | 509 |
| Year-on-Year Change | -1.2% | -13.2% | 9.8% | 57.2% | -230.1% |
| Free Operating Cashflow | 77 | 276 | 369 | 281 | 287 |
| Year-on-Year Change | -71.9% | -25.4% | 31.4% | -2.1% | -146.4% |
| Total Debt | 5,466 | 5,626 | 5,093 | 4,952 | 4,694 |
| Year-on-Year Change | -2.9% | 10.5% | 2.9% | 5.5% | 3.5% |
| Net Debt | 5,232 | 4,717 | 4,397 | 3,787 | 3,561 |
| Year-on-Year Change | 10.9% | 7.3% | 16.1% | 6.3% | 8.6% |
| Shares Outstanding-ordinary shares (Million) | 180.1 | 188.8 | 197.5 | 214.6 | 214.5 |
| Year-on-Year Change | -4.6% | -4.4% | -8.0% | 0.1% | 0.1% |
| Payout Ratio | 82.6% | 82.5% | 124.1% | 128.8% | 27.5% |
| ⇑ – Year-on-Year Increase | Green: ‘Improved’ |
| ⇓ – Year-on-Year Decrease | Red: ‘Worsened’ |
| ⇔ – Year-on-Year Unchanged |
| 2026 | 2025 | 2024 | 2023 | 2022 | |
| CAPITAL STRUCTURE | |||||
| Total Debt/(Total Debt + Equity) | 63.5%⇑ | 62.8%⇑ | 59.1%⇑ | 54.6%⇑ | 53.3%⇓ |
| Net Debt/Equity | 166.8%⇑ | 141.5%⇑ | 124.9%⇑ | 92.1%⇑ | 86.5%⇑ |
| Debt/Total Assets | 57.1%⇑ | 56.8%⇑ | 53.5%⇑ | 49.8%⇑ | 49.1%⇓ |
| Long Term Debt/Net Earnings | 25.0x⇑ | 22.6x⇓ | 32.0x⇓ | 38.9x⇑ | 16.9x⇑ |
| Current Ratio | 0.4x⇓ | 0.8x⇓ | 1.0x⇓ | 1.6x⇓ | 1.8x⇑ |
| Acid Test Ratio | 0.4x⇓ | 0.8x⇓ | 0.9x⇓ | 1.6x⇓ | 1.7x⇑ |
| CASHFLOW RATIOS | |||||
| Funds from Operations/Total Debt | 0.1x⇔ | 0.1x⇓ | 0.2x⇔ | 0.2x⇑ | 0.1x⇑ |
| Funds from Operations/Net Debt | 0.1x⇓ | 0.2x⇔ | 0.2x⇔ | 0.2x⇑ | 0.1x⇑ |
| EBITDA/Interest | 4.5x⇓ | 4.9x⇓ | 5.3x⇑ | 5.1x⇑ | 3.2x⇑ |
| EBIT/Interest | 2.3x⇓ | 2.7x⇓ | 3.2x⇑ | 3.0x⇑ | 1.3x⇑ |
| Net Debt/EBITDA | 5.9x⇑ | 5.2x⇑ | 4.6x⇑ | 4.5x⇓ | 6.4x⇑ |
| Free Operating Cashflow/Interest | 0.4x⇓ | 1.5x⇓ | 2.1x⇑ | 1.7x⇔ | 1.7x⇑ |
| Free Operating Cashflow/Net Debt | 0.0x⇓ | 0.1x⇔ | 0.1x⇔ | 0.1x⇔ | 0.1x⇑ |
| Free Operating Cashflow/Sales | 0.0x⇓ | 0.1x⇔ | 0.1x⇔ | 0.1x⇓ | 0.2x⇑ |
| PROFITABILITY RATIOS | |||||
| EBITDA Margin | 30.5%⇓ | 31.3%⇓ | 32.0%⇓ | 32.4%⇓ | 32.5%⇑ |
| EBIT Margin | 15.9%⇓ | 17.6%⇓ | 19.1%⇓ | 19.2%⇑ | 13.3%⇑ |
| PBT Margin | 10.2%⇓ | 12.6%⇓ | 15.3%⇑ | 14.3%⇑ | 3.4%⇑ |
| PAT Margin | 7.3%⇓ | 8.7%⇓ | 10.5%⇓ | 10.6%⇑ | 2.5%⇑ |
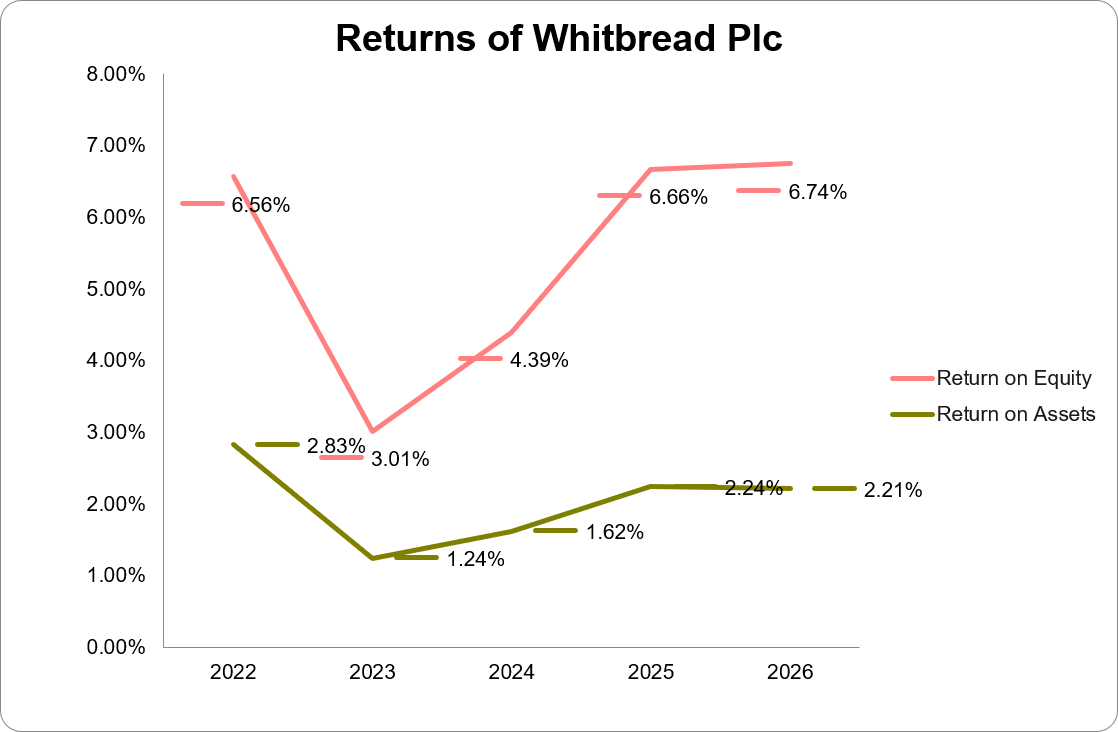
| ROAE | 6.5%⇔ | 6.5%⇑ | 4.1%⇑ | 3.0%⇓ | 6.8%⇑ |
| ROAA | 2.2%⇓ | 2.3%⇑ | 1.6%⇑ | 1.3%⇓ | 2.9%⇑ |