| Ticker: KS 005930 | Nature of Business: Technology Services | Location: South Korea |
| Recent Price: ₩108,400 | 52-Week High/Low: ₩112,400/50,800 | Estimated Fair Value:₩98,889.66-₩125,138.72 |
| Expected Return: 24.2% | Consider Buy: Below ₩112,014.19 | Business Risk: High |
| Financial Risk: Medium | Economic Moat: Weak | Corporate Governance: Strong |
Company Overview
Samsung Electronics Co., Ltd. (SAMSUNG) is a renowned manufacturer of electronic, semiconductor, information technology, and mobile communications products. It was established in 1969 in the Republic of Korea. The acquisition of Korea Semiconductor Co. (1977) and Korea Electronics Information Co. (1979) expanded its product portfolio, which now includes Solid State Drives (SSD), Portable SSDs, memory cards, USB Flash drives and Dynamic Random Access Memory (DRAM). The shares of SAMSUNG were listed on the Korea Stock Exchange in 1975 while its Global Depositary Receipt (GDR) common shares are listed on the London Stock Exchange.
The hallmarks of the company include continuous investment in Research and Development (R&D), acquisitions and joint venture agreements with other companies. Its partnership with Sanyo Electric Co., Ltd (Japan) led to the production of black-and-white televisions in 1970. It partnered with Sony Corporation (Japan) in 2003 to establish S-LCD, which manufactures Thin-Film Transistor Liquid Crystal Display (TFT-LCD) panels. The acquisitions made by SAMSUNG include SmartThings (an American home automation company) in 2014, YESCO (LED displays manufacturer) in 2015 and Harman International (an American electronics company) in 2017.
SAMSUNG’s board of directors comprises three executive directors and six independent directors. Je-Yoon Shin became the chairman of the board of directors of SAMSUNG in March 2024. Young-Hyun Jun is the vice chairman and Chief Executive Officer (CEO) of SAMSUNG. Jun is also the head of Device Solutions (DS) at SAMSUNG. Tae-Moon Roh doubles as president and CEO. Roh, formerly in charge of the Design Management Centre, now heads the Device eXperience (DX) division of the company. Jai-Hyuk Song is president and chief technology officer of the Device Solutions (DS) division.
Investment Thesis
SAMSUNG, which began as a manufacturer of electrical appliances, has grown into a multinational company offering mobile phones, connected car systems, audio and visual systems, enterprise automation solutions and connected services. The company has grown its revenue at a compound annual growth rate of 3.9% over the past ten years. Besides, SAMSUNG is a profitable company. Operating profit has expanded by 2.7% on a 10-Year Compound Annual Growth Rate (CAGR) basis, while Profit After Tax (PAT) has increased by 4.0% over the past ten years. Despite its huge capital expenditure, the company generates free cash flow and pays dividends to the shareholders regularly. SAMSUNG is a low-geared company that is not bogged down by debts.
SAMSUNG is not resting on its laurels even though it is one of the prominent players in the global electronics, smartphone and memory markets. As a trailblazer in technology, its R&D focuses on future technologies, next-generation media and next-generation communications. It has R&D centres in the US, the UK, Canada, Russia, Poland, Israel, India, China, Japan and Taiwan. In addition, it collaborates with research centres, universities, research institutes and other companies to improve its technological capabilities and produce innovative products. SAMSUNG has been able to produce energy-efficient memory solutions to power artificial intelligence (AI), 5G and autonomous driving. In 2024, it developed the fastest LPDDR5X DRAM for AI and pioneered the mass production of 9th-generation V-NAND.
The company’s earnings from memory and storage devices are increasing and it continues to invest in its semiconductor production capacity. Revenue from its memory products almost doubled between 2023 and 2024. Memory products accounted for 28.1% of total revenue in 2024. We expect demand for memory products to continue to grow due to rising demand for personal computers, automotive solutions, server and mobile devices.
The company’s stock currently trades at a discount to our fair value estimate. We expect investors to buy a share of SAMSUNG below KRW112,014.19. It should produce a return of 24.2%.
Valuation
Based on our valuation, SAMSUNG is worth between KRW98,889.66 and KRW125,138.72 per share.
Financial Overview
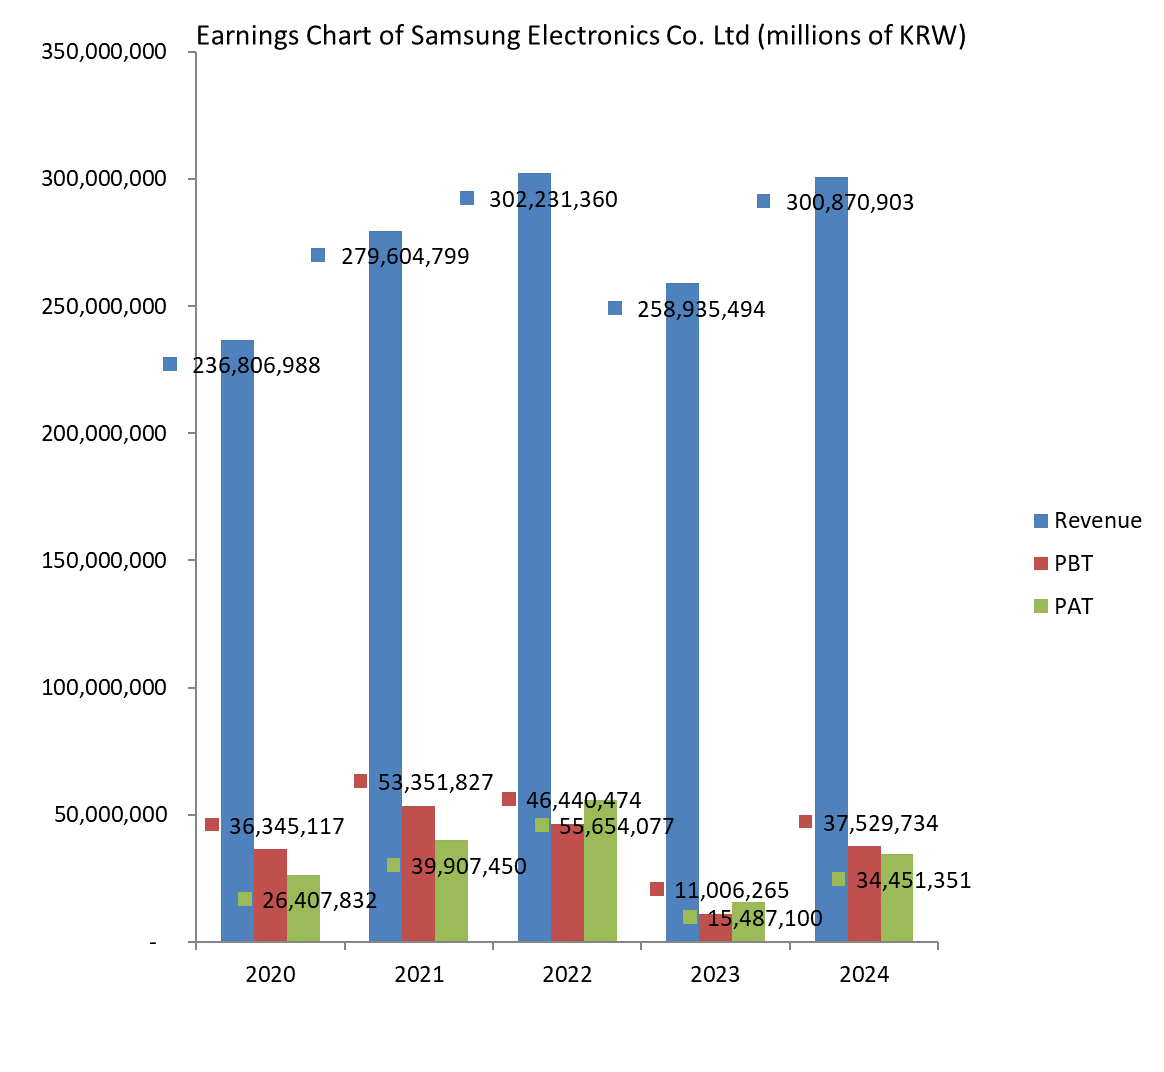
SAMSUNG grew its revenue by 16.2% from KRW258.9 trillion in 2023 to KRW300.9 trillion in 2024. America was the biggest destination for its products, accounting for 39.5% of total sales revenue (2023: 35.6%). Korea generated 13.2% of sales (2023: 17.6%) while China was responsible for 14.6% (2023: 10.9%). Revenue from all sales regions, except Korea, improved over the previous year’s performance. Sales from America grew by 29% to KRW118.8 trillion, while revenue from Asia and Africa rose by 7.5% year-over-year. Sales to China leaped by 55.4% to KRW43.9 trillion compared to a 20.6% decline in the previous fiscal year. After two consecutive years of decline, revenue from Europe increased by 4.2% to close at KRW50.1 trillion at the 2024 year-end. SAMSUNG made KRW39.8 trillion in revenue from Korea in 2024, down from KRW45.6 trillion in 2023.
The gross profit increased by 45.5% year-over-year to KRW114.3 trillion, having recovered from the decline of the previous two years. The gross profit margin gained 7.7 percent despite a 3.4% increase in the cost of sales to KRW186.6 trillion. The operating profit was KRW32.7 trillion in 2024, up by 398.3% from KRW6.6 trillion in 2023. Profit Before Tax (PBT) grew by 241.0% to KRW37.5 trillion compared to the prior year, when it dropped 76.3% to KRW11 trillion. SAMSUNG’s PAT jumped by 122.5% year-over-year to KRW34.5 trillion.
Earnings Before Interest, Taxes, Depreciation and Amortisation (EBITDA) grew by 66.6% to close at KRW75.4 trillion. This was equivalent to an EBITDA margin of 25.1% (2023: 17.5%). The operating profit margin improved by 8.3 percentage points year-over-year despite a rise in costs. PBT margin added 8.2 percent to 12.5% while PAT margin increased from 6.0% to 11.5%. The Return on Average Equity (RoAE) and Return on Average Assets (RoAA) stood at 13.4% and 10.6% respectively.
SAMSUNG generates free cash flow for its shareholders despite its consistent spending on capital. Total debt accounted for 3.3% of total assets and 4.3% of total equity in 2024. Net cash stood at KRW36.6 trillion as at 31st December 2024 (2023: KRW57.7 trillion). Working capital management is good as the company’s short-term assets can cover its current liabilities. The company is not cash-strapped and can meet its obligations when due; furthermore, it is not overburdened by debt.
Business Risk
SAMSUNG is exposed to foreign exchange risk as transactions are conducted in multiple currencies. Currency volatility can adversely affect its bottom line. The company has been investing in future technologies such as artificial intelligence (AI), data intelligence, next-generation communications, robotics and next-generation media; these technologies are emerging and require huge spending, which could impact the profitability of SAMSUNG. Also, competition is intensifying, thereby putting pressure on profit margins.
Recommendation: Buy

| (KRW in Million) | 2024 | 2023 | 2022 | 2021 | 2020 |
| Turnover | 300,870,903 | 258,935,494 | 302,231,360 | 279,604,799 | 236,806,988 |
| Year-on-Year Change | 16.2% | -14.3% | 8.1% | 18.1% | 2.8% |
| Operating Profit | 32,725,961 | 6,566,976 | 43,376,630 | 51,633,856 | 35,993,876 |
| Year-on-Year Change | 398.3% | -84.9% | -16.0% | 43.5% | 29.6% |
| EBITDA | 75,356,783 | 45,233,535 | 82,484,289 | 85,881,217 | 66,329,492 |
| Year-on-Year Change | 66.6% | -45.2% | -4.0% | 29.5% | 15.6% |
| PBT | 37,529,734 | 11,006,265 | 46,440,474 | 53,351,827 | 36,345,117 |
| Year-on-Year Change | 241.0% | -76.3% | -13.0% | 46.8% | 19.4% |
| PAT | 34,451,351 | 15,487,100 | 55,654,077 | 39,907,450 | 26,407,832 |
| Year-on-Year Change | 122.5% | -72.2% | 39.5% | 51.1% | 21.5% |
| Total Assets | 514,531,948 | 455,905,980 | 448,424,507 | 426,621,158 | 378,235,718 |
| Year-on-Year Change | 12.9% | 1.7% | 5.1% | 12.8% | 7.3% |
| Net Current Assets | 133,735,967 | 120,217,105 | 140,125,729 | 130,046,052 | 122,611,228 |
| Year-on-Year Change | 11.3% | -14.2% | 7.8% | 6.1% | 4.3% |
| Total Equity | 402,192,070 | 363,677,865 | 354,749,604 | 304,899,931 | 275,948,016 |
| Year-on-Year Change | 10.6% | 2.5% | 16.4% | 10.5% | 5.0% |
| Capital Expenditure | 53,741,639 | 60,534,167 | 53,126,732 | 49,829,021 | 40,271,813 |
| Year-on-Year Change | -11.22% | 13.94% | 6.62% | 23.73% | 40.72% |
| Funds from Operations | 72,982,621 | 44,137,427 | 62,181,346 | 65,105,448 | 65,287,009 |
| Year-on-Year Change | 65.4% | -29.0% | -4.5% | -0.3% | 43.9% |
| Free Operating Cashflow | 19,240,982 | -16,396,740 | 9,054,614 | 15,276,427 | 25,015,196 |
| Year-on-Year Change | -217.4% | -281.1% | -40.7% | -38.9% | 49.2% |
| Total Debt | 17,122,894 | 11,377,069 | 9,244,080 | 17,062,181 | 19,501,282 |
| Year-on-Year Change | 50.5% | 23.1% | -45.8% | -12.5% | 11.0% |
| Net Debt | -36,582,685 | -57,703,824 | -40,436,630 | -21,969,234 | -9,881,296 |
| Year-on-Year Change | -36.6% | 42.7% | 84.1% | 122.3% | 6.0% |
| Shares Outstanding (Million) | 5,970 | 5,970 | 5,970 | 5,970 | 5,970 |
| Year-on-Year Change | 0.0% | 0.0% | 0.0% | 0.0% | 0.0% |
| Payout Ratio | 16.8% | 45.8% | 144.5% | 17.3% | 78.7% |
| ⇑ – Year-on-Year Increase | Green: ‘Improved’ |
| ⇓ – Year-on-Year Decrease | Red: ‘Worsened’ |
| ⇔ – Year-on-Year Unchanged |
| 2024 | 2023 | 2022 | 2021 | 2020 | |
| CAPITAL STRUCTURE | |||||
| Total Debt/(Total Debt + Equity) | 4.1%⇑ | 3.0%⇑ | 2.5%⇓ | 5.3%⇓ | 6.6%⇑ |
| Net Debt/Equity | -9.1%⇑ | -15.9%⇓ | -11.4%⇓ | -7.2%⇓ | -3.6%⇔ |
| Debt/Total Assets | 3.3%⇑ | 2.5%⇑ | 2.1%⇓ | 4.0%⇓ | 5.2%⇑ |
| Long Term Debt/Net Earnings | 0.1x⇓ | 0.2x⇑ | 0.1x⇔ | 0.1x⇔ | 0.1x⇔ |
| Current Ratio | 2.4x⇓ | 2.6x⇓ | 2.8x⇑ | 2.5x⇓ | 2.6x⇓ |
| Acid Test Ratio | 1.9x⇔ | 1.9x⇓ | 2.1x⇑ | 2.0x⇓ | 2.2x⇓ |
| CASHFLOW RATIOS | |||||
| Funds from Operations/Total Debt | 4.3x⇑ | 3.9x⇓ | 6.7x⇑ | 3.8x⇑ | 3.4x⇑ |
| Funds from Operations/Net Debt | -2.0x⇓ | -0.8x⇑ | -1.5x⇑ | -3.0x⇑ | -6.6x⇓ |
| EBITDA/Interest | 5.8x⇑ | 3.6x⇓ | 4.3x⇓ | 11.2x⇑ | 5.9x⇓ |
| EBIT/Interest | 2.5x⇑ | 0.5x⇓ | 2.3x⇓ | 6.7x⇑ | 3.2x⇓ |
| Net Debt/EBITDA | -0.5x⇑ | -1.3x⇓ | -0.5x⇓ | -0.3x⇓ | -0.2x⇔ |
| Free Operating Cashflow/Interest | 1.5x⇑ | -1.3x⇓ | 0.5x⇓ | 2.0x⇓ | 2.2x⇑ |
| Free Operating Cashflow/Net Debt | -0.5x⇓ | 0.3x⇑ | -0.2x⇑ | -0.7x⇑ | -2.5x⇓ |
| Free Operating Cashflow/Sales | 0.1x⇑ | -0.1x⇓ | 0.0x⇓ | 0.1x⇔ | 0.1x⇔ |
| PROFITABILITY RATIOS | |||||
| Gross Profit Margin | 38.0%⇑ | 30.3%⇓ | 37.1%⇓ | 40.5%⇑ | 39.0%⇑ |
| EBITDA Margin | 25.1%⇑ | 17.5%⇓ | 27.3%⇓ | 30.7%⇑ | 28.0%⇑ |
| EBIT Margin | 10.9%⇑ | 2.5%⇓ | 14.4%⇓ | 18.5%⇑ | 15.2%⇑ |
| PBT Margin | 12.5%⇑ | 4.3%⇓ | 15.4%⇓ | 19.1%⇑ | 15.4%⇑ |
| PAT Margin | 11.5%⇑ | 6.0%⇓ | 18.4%⇑ | 14.3%⇑ | 11.2%⇑ |
| ROAE | 13.4%⇑ | 5.2%⇓ | 18.1%⇑ | 17.2%⇑ | 8.4%⇓ |
| ROAA | 10.6%⇑ | 4.2%⇓ | 13.6%⇑ | 12.4%⇑ | 6.2%⇓ |