| Ticker: 000660 | Nature of Business: Semiconductors | Location: Korea |
| Recent Price: ₩1,913,000 | 52-Week High/Low: ₩2,987,000/ 245,000 | Estimated Fair Value: ₩420,387.86 – ₩501,739.05 |
| Expected Return: 34.3% | Consider Buy: Below ₩420,387.86 | Business Risk: High |
| Financial Risk: Medium | Economic Moat: Weak | Corporate Governance: Strong |
Company Overview
SK Hynix Inc, formerly Hyundai Electronics Industries Co. Limited, is a semiconductor company established in South Korea on October 15, 1949. SK Hynix produces and distributes memory chips for smartphones, networking, data centre servers, personal computers, and automotive applications. The company’s shares are traded on the Korea Exchange. Its global depositary receipts trade on the Luxembourg Stock Exchange while its American Depositary Shares are traded on NASDAQ.
SK Hynix’s production facilities are sited in South Korea and China. The facilities are supported by robust semiconductor research and development centres in South Korea, Italy, U.S.A., Taiwan, Belarus, China, Poland, Canada and Mexico.
The company continues to invest in technology to maintain its market share in the memory chips business and develop leadership position in the artificial intelligence (AI) memory business. Research & Development (R&D) cost stood at ₩6.5 trillion in 2025 (2024: ₩4.4 trillion). Consequently, SK Hynix has become a major supplier of high-speed and power-efficient memory for AI servers, mobile devices and data centres. In addition, it has been upgrading its capacity so that it can produce more advanced memory chips.
SK Square Co. Limited is the major shareholder of SK Hynix with 20.5% equity stake in the company. The ten-member board comprises two executive directors, two non-executive directors and six independent directors. Kwak Noh-Jung is the president and chief executive officer of the company.
Investment Thesis
SK Hynix is one of the leading makers of Dynamic Random-Access Memory (DRAM) and NAND flash memory chips in the world. The company has been at the forefront of technological innovation, chalking up lots of firsts in the memory market, including the development of HBM4 in 2025. HBM4 (High Bandwidth Memory) is a next generation memory product with improved bandwidth and power efficiency for ultra-high-performance AI.
There is strong demand for smartphones, servers, personal computers and AI products. SK Hynix is well-positioned to meet the demand for AI memory products having developed its technological competence in the semiconductor business for over four decades. The company has become a leader in providing memory solutions for the whole AI ecosystem, taking advantage of the rising demand for AI data centres. It has the capacity to provide custom-made DRAM and NAND flash products to satisfy the needs of its various customers across the AI value chain.
The U.S.A. remains the major market for the company’s products followed by China. U.S.A. and China have generated 44.6% and 33% of total revenue respectively. Also, sales revenue from the U.S.A. has grown at a 3-Year Compound Annual Growth Rate (CAGR) of 40.8%, while the revenue from China has risen by 16.2% over the past three years. On average, South Korea has produced 4% of revenue in the last ten years.
SK Hynix is a profitable company with regular dividend payment. The company has delivered a 10-year EBITDA (Earnings Before Interest, Taxes, Depreciation, and Amortisation) margin of 49.7%. Operating profit margin averaged 24.7% and Profit After Tax margin (PAT) averaged out to 18.7%. The total assets are rising and the company’s debt is manageable.
Valuation
SK Hynix has a Book Value Per Share of ₩ 174,373.92 in 2025, up by 62.5% year-on-year. Adjusted Earnings Power Value (EPV) of the company is ₩ 773,850. A share of the company should trade between ₩420,387.86 and ₩501,739.05.
Financial Overview
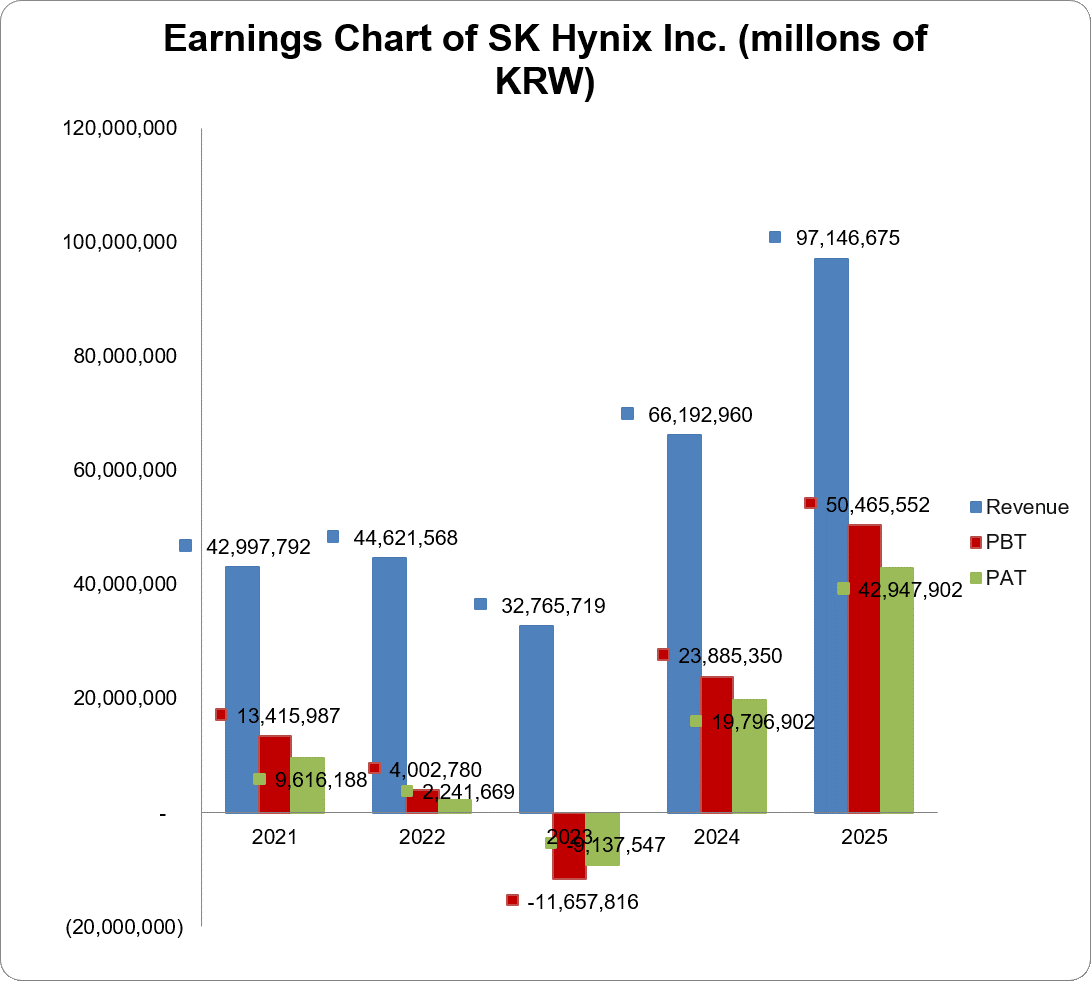
DRAM and NAND Flash memory chips are responsible for the bulk of the revenue of SK Hynix. DRAM and NAND Flash sales have generated, on average, 96% of the company’s total revenue in the last ten years. The total revenue of SK Hynix jumped by 46.8% from ₩66.2 trillion in 2024 to ₩97.1 trillion in 2025. DRAM chips produced ₩74.9 trillion or 77.1% of total revenue (2024: ₩44.7 trillion or 67.6% of total revenue). NAND Flash sales revenue was ₩20.7 trillion which represented 21.3% of total sales (2024: ₩19.3 trillion or 29.1% of total sales).
The revenue from the USA, its major market, leaped by 59.4% year-on-year to ₩66.9 trillion in 2025, as against ₩42 trillion in 2024. SK Hynix made a revenue of ₩19.1 trillion from China in 2025 compared to ₩15.5 trillion in the previous year.
SK Hynix turned a profit for two years in a row after recovering from the 2023 loss. The gross profit was ₩58.7 trillion in 2025 compared to a gross profit of ₩31.8 trillion in 2024. The gross profit margin of 60.4% exceeded the 10-year average by 19.6 percentage points. The operating profit of ₩47.2 trillion in 2025 was tantamount to an operating profit margin of 48.6%. There was an operating profit margin of 35.5% in the earlier year. The company posted a Profit Before Tax (PBT) and Profit After Tax (PAT) of ₩50.5 trillion and ₩42.9 trillion respectively. Both PBT and PAT margins stood at 52% and 44.2% respectively. Total equity gained ₩46.8 trillion or 63.3% year-on-year to close at ₩120.7 trillion at the 2025 year-end. Total debt rose by 9.1% year-on-year to ₩29.7 trillion. Debt to assets ratio decreased from 22.7% in 2024 to 16.9% in 2025 while debt to equity ratio dropped 12.2 percentage points to 24.6%. The company generates enough profit and cash to pay of its interest on debts. In 2025, operating profit and operating cash flow covered interest expense 3.8 and 4.3 times respectively.
Business Risk
Competition is ramping up globally and the players must increase their spending on technology. This raises costs and depresses profit margins going forward. SK Hynix depends on customers outside South Korea for sales- mainly the USA and China. The contribution of other Asian countries, apart from China, has trailed the ten-year average for four consecutive years. The company has found it increasingly difficult to penetrate Europe, which has produced less than 4% of total revenue over the past ten years. In addition, it is subject to a multiplicity of regulations which can make earnings volatile.
Recommendation: Overpriced
| (KRW in Million) | 2025 | 2024 | 2023 | 2022 | 2021 |
| Turnover | 97,146,675 | 66,192,960 | 32,765,719 | 44,621,568 | 42,997,792 |
| Year-on-Year Change | 46.8% | 102.0% | -26.6% | 3.8% | 34.8% |
| Operating Profit | 47,206,319 | 23,467,319 | -7,730,313 | 6,809,417 | 12,410,340 |
| Year-on-Year Change | 101.2% | -403.6% | -213.5% | -45.1% | 147.6% |
| EBITDA | 61,095,958 | 36,012,086 | 5,888,848 | 20,944,709 | 23,057,227 |
| Year-on-Year Change | 69.7% | 511.5% | -71.9% | -9.2% | 56.0% |
| PBT | 50,465,552 | 23,885,350 | -11,657,816 | 4,002,780 | 13,415,987 |
| Year-on-Year Change | 111.3% | -304.9% | -391.2% | -70.2% | 115.1% |
| PAT | 42,947,902 | 19,796,902 | -9,137,547 | 2,241,669 | 9,616,188 |
| Year-on-Year Change | 116.9% | -316.7% | -507.6% | -76.7% | 102.1% |
| Total Assets | 176,107,659 | 119,855,209 | 100,330,165 | 103,871,512 | 96,346,525 |
| Year-on-Year Change | 46.9% | 19.5% | -3.4% | 7.8% | 35.4% |
| Net Current Assets | 32,079,074 | 17,313,443 | 9,460,290 | 8,889,636 | 12,171,680 |
| Year-on-Year Change | 85.3% | 83.0% | 6.4% | -27.0% | 62.3% |
| Total Equity | 120,666,751 | 73,915,704 | 53,503,752 | 63,290,542 | 62,191,058 |
| Year-on-Year Change | 63.3% | 38.2% | -15.5% | 1.8% | 19.8% |
| Capital Expenditure | 28,579,343 | 16,662,640 | 8,779,848 | 19,748,882 | 13,460,528 |
| Year-on-Year Change | 71.5% | 89.8% | -55.5% | 46.7% | 23.8% |
| Funds from Operations | 53,373,126 | 29,795,885 | 4,278,191 | 14,780,517 | 19,797,648 |
| Year-on-Year Change | 79.1% | 596.5% | -71.1% | -25.3% | 60.8% |
| Free Operating Cashflow | 24,793,783 | 13,133,245 | -4,501,657 | -4,968,365 | 6,337,120 |
| Year-on-Year Change | 88.8% | -391.7% | -9.4% | -178.4% | 338.5% |
| Total Debt | 29,674,214 | 27,199,605 | 33,980,733 | 24,796,561 | 19,154,790 |
| Year-on-Year Change | 9.1% | -20.0% | 37.0% | 29.5% | 47.5% |
| Net Debt | 14,750,448 | 15,994,488 | 26,393,404 | 19,819,554 | 14,096,808 |
| Year-on-Year Change | -7.8% | -39.4% | 33.2% | 40.6% | 40.9% |
| Shares Outstanding (Million) | 692 | 689 | 688 | 688 | 686 |
| Year-on-Year Change | 0.4% | 0.2% | 0.0% | 0.3% | 0.3% |
| Payout Ratio | 4.8% | 7.7% | -9.0% | 36.8% | 11.0% |
| ⇑ – Year-on-Year Increase | Green: ‘Improved’ |
| ⇓ – Year-on-Year Decrease | Red: ‘Worsened’ |
| ⇔ – Year-on-Year Unchanged |
| 2025 | 2024 | 2023 | 2022 | 2021 | |
| CAPITAL STRUCTURE | |||||
| Total Debt/(Total Debt + Equity) | 19.7%⇓ | 26.9%⇓ | 38.8%⇑ | 28.2%⇑ | 23.6%⇑ |
| Net Debt/Equity | 12.2%⇓ | 21.6%⇓ | 49.3%⇑ | 31.3%⇑ | 22.7%⇑ |
| Debt/Total Assets | 16.9%⇓ | 22.7%⇓ | 33.9%⇑ | 23.9%⇑ | 19.9%⇑ |
| Long Term Debt/Net Earnings | 0.4x⇓ | 0.9x⇑ | -2.4x⇓ | 6.1x⇑ | 1.5x⇓ |
| Current Ratio | 1.9x⇑ | 1.7x⇑ | 1.5x⇔ | 1.5x⇓ | 1.8x⇔ |
| Acid Test Ratio | 1.5x⇑ | 1.2x⇑ | 0.8x⇑ | 0.7x⇓ | 1.2x⇔ |
| CASHFLOW RATIOS | |||||
| Funds from Operations/Total Debt | 1.8x⇑ | 1.1x⇑ | 0.1x⇓ | 0.6x⇓ | 1.0x⇔ |
| Funds from Operations/Net Debt | 3.6x⇑ | 1.9x⇑ | 0.2x⇓ | 0.8x⇓ | 1.4x⇑ |
| EBITDA/Interest | 4.9x⇓ | 6.3x⇑ | 1.0x⇓ | 4.1x⇓ | 15.7x⇑ |
| EBIT/Interest | 3.8x⇓ | 4.1x⇑ | -1.3x⇓ | 1.3x⇓ | 8.4x⇑ |
| Net Debt/EBITDA | 0.2x⇓ | 0.4x⇓ | 4.5x⇑ | 1.0x⇑ | 0.6x⇓ |
| Free Operating Cashflow/Interest | 2.0x⇓ | 2.3x⇑ | -0.7x⇑ | -1.0x⇓ | 4.3x⇑ |
| Free Operating Cashflow/Net Debt | 1.7x⇑ | 0.8x⇑ | -0.2x⇑ | -0.3x⇓ | 0.5x⇑ |
| Free Operating Cashflow/Sales | 0.3x⇑ | 0.2x⇑ | -0.1x⇔ | -0.1x⇓ | 0.2x⇑ |
| PROFITABILITY RATIOS | |||||
| Gross Profit Margin | 60.4%⇑ | 48.1%⇑ | -1.6%⇓ | 35.0%⇓ | 44.1%⇑ |
| EBITDA Margin | 62.9%⇑ | 54.4%⇑ | 18.0%⇓ | 46.9%⇓ | 53.6%⇑ |
| EBIT Margin | 48.6%⇑ | 35.5%⇑ | -23.6%⇓ | 15.3%⇓ | 28.9%⇑ |
| PBT Margin | 52.0%⇑ | 36.1%⇑ | -35.6%⇓ | 9.0%⇓ | 31.2%⇑ |
| PAT Margin | 44.2%⇑ | 29.9%⇑ | -27.9%⇓ | 5.0%⇓ | 22.4%⇑ |
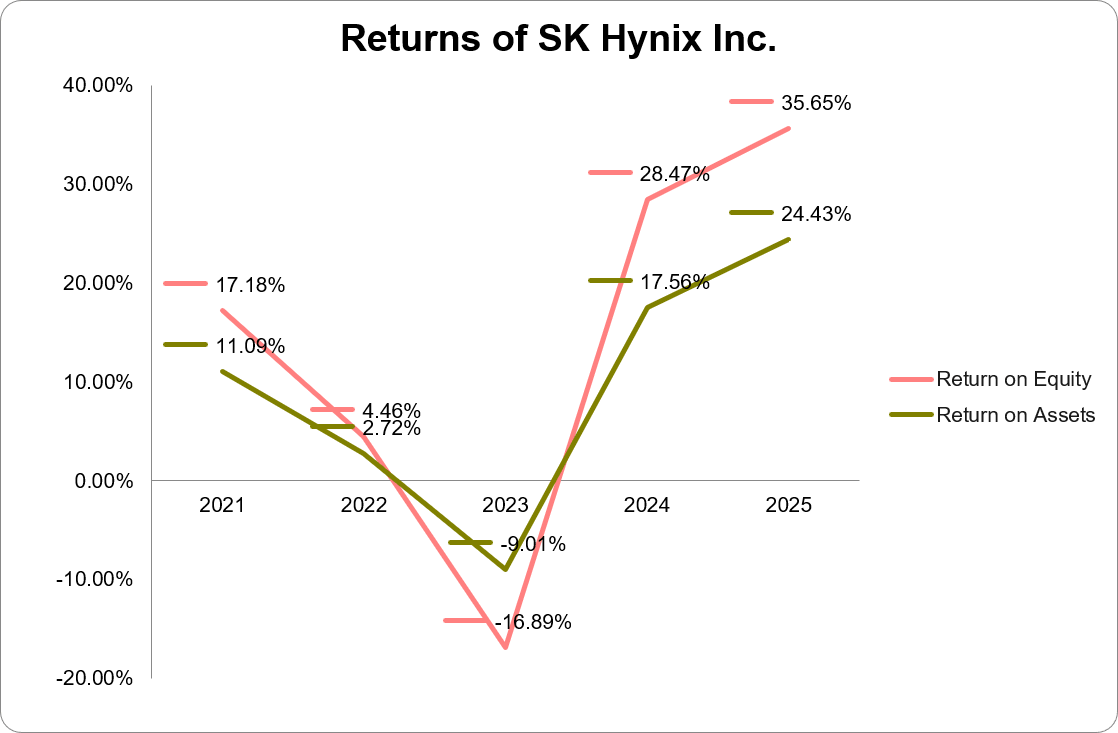
| ROAE | 44.2%⇑ | 33.0%⇑ | -15.5%⇓ | 4.5%⇓ | 18.7%⇑ |
| ROAA | 29.1%⇑ | 19.1%⇑ | -8.9%⇓ | 2.8%⇓ | 12.8%⇑ |