| Ticker: TRANSPOWER | Nature of Business: Electric Power Generation | Location: Nigeria |
| Recent Price: NGN219.60 | 52-Week High/Low: NGN342.00/197.70 | Estimated Fair Value: NGN302.94-NGN419.54 |
| Expected Return: 39.5% | Consider Buy: Below NGN361.24 | Business Risk: Medium |
| Financial Risk: Medium | Economic Moat: Weak | Corporate Governance: Strong |
Company Overview
Transcorp Power Limited (TRANSPOWER) emerged from the merger of Transcorp Ughelli Power Limited and Ughelli Power Plc in 2015. Transcorp Ughelli Power Limited, a private company incorporated in September 2012, purchased Ughelli Power Plc from the federal government of Nigeria in 2013. Ughelli Power Plc owns the 972MW Ughelli Power Plant in Delta State, Nigeria. Transcorp Power Limited became Transcorp Power Plc (TRANSPOWER), following its conversion to a public company in December 2023. It is a subsidiary of Transnational Corporation Plc. TRANSPOWER was listed on the Nigerian Stock Exchange on March 4, 2024.
Mr. Emmanuel Nnorom chairs the company’s board of directors. Engr. Peter Ikenga is the Chief Executive Officer of TRANSPOWER. Mr. Adim Jibunoh, a Non-Executive Director, retired on 30th December 2025.
Investment Thesis
TRANSPOWER operates the gas-fired Ughelli Power Plant in Delta State, Nigeria, West Africa. Natural gas is the major raw material required for its gas turbines. The company spent NGN199.5 billion on natural gas in 2025 (2024: NGN151 billion). Natural gas cost was 92.2% of cost of sales in 2025 and 2024. Natural gas cost was 50.1% of total revenue in 2025 (2024: 49.3%). TRANSPOWER is strategically located in the Niger Delta region of Nigeria with an enormous amount of Nigeria’s natural gas. This reduces the risk of disruption to its operations from irregular supply of gas. Electric power sales have been increasing consistently in the past six years. The company’s total revenue has increased more than sixfold over the last six years. The company’s Earnings Before Interest, Taxes, Depreciation and Amortisation (EBITDA) of NGN130.6 billion in 2025 represents a 6-Year Compound Annual Growth Rate (CAGR) of 36.1%.
Furthermore, the company is positioning itself to take advantage of the opportunities in the West African energy market. The West African energy market is growing as the region requires reliable and accessible power to support economic growth. Electric power sales in Nigeria, its major market, have grown at a CAGR of 34.9% over the past five years. The sale of electricity to Nigerian customers has accounted for an average of 81.9% over the past five years. The company has been able to serve other markets outside Nigeria by joining the West African Power Pool (WAPP) in 2018. We were convinced, with the benefit of hindsight, that this was the right strategic move by the company’s management. In 2020, the sale of electricity to customers outside Nigeria was NGN2.1 billion; it rose to NGN117 billion in 2025. In addition, foreign markets (outside Nigeria) accounted for the bulk of the increase in revenue in the 2025 fiscal year. 67.6% of the sales increase in 2025 came from offshore customers of the company, while its local customers were responsible for 32.5%.
However, TRANSPOWER is not immune to the liquidity pressure in its industry. Because power generated has to pass through the national grid before being distributed by some other companies to the consumers, there are huge trade receivables. The distribution companies bill the customers and pay the government agency that is the sole buyer of power from generation companies in Nigeria, the Nigerian Bulk Electricity Trading Plc. Gross trade receivables were NGN447.3 billion in 2025, with an impairment provision of NGN27.6 billion or 6.2%.
The debt of the company has become manageable, standing at NGN63.6 billion at the end of the second quarter of 2026. Sufficient cover from operating profit exists for interest expense. The shareholders also receive dividends regularly.
Valuation
The fair value of the company’s share ranges from NGN302.94 to NGN419.54 per share.
Financial Overview
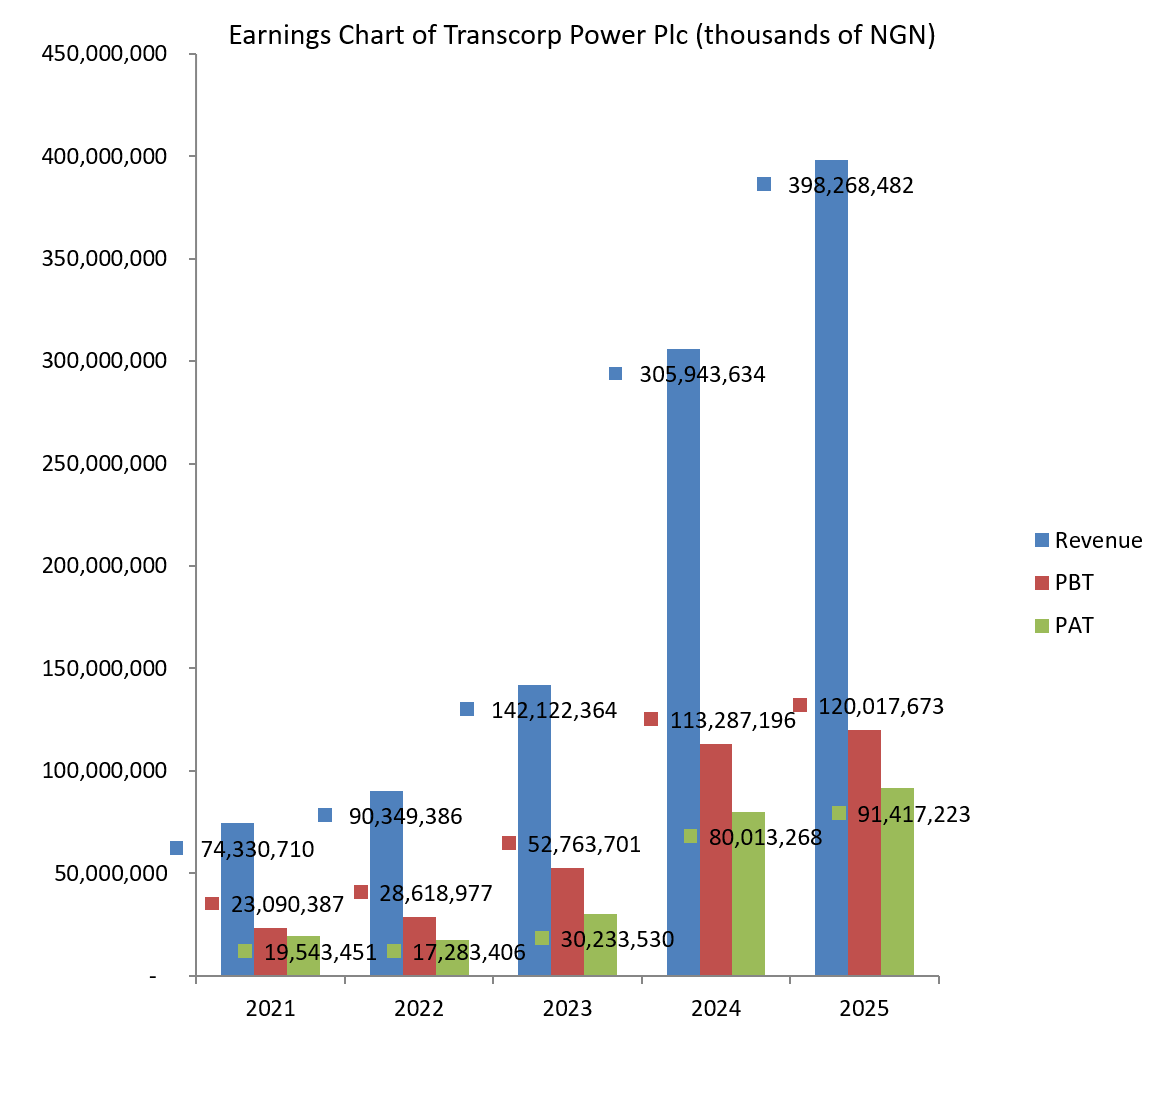
TRANSPOWER posted revenue of NGN398.3 billion in 2025, which was 30.2% higher than NGN305.9 billion made in the previous year. International sales produced NGN117 billion or 29.4% of total revenue in 2025 (2024: NGN54.7 billion or 17.9% of total revenue). Offshore revenue has been expanding; revenue from its international customers jumped by 114.1% year-on-year to NGN117 billion. In fact, international customers were responsible for 67.6% of the revenue increase in 2025 compared with 17.9% in the prior year. Revenue from Nigeria rose 11.9% from NGN251.3 billion in 2024 to NGN281.2 billion in 2025.
Operating expenses rose by 101.8% from NGN28.2 billion in 2024 to NGN56.9 billion in 2025. Operating profit rose by NGN11 billion or 9.7% year-on-year to NGN125.1 billion. In the prior year, operating profit gained NGN49.4 billion or 76.5%. Profit Before Tax (PBT) increased by 5.9% year-on year to NGN120 billion, while Profit After Tax (PAT) was 14.3% up from NGN80 billion in 2024 to NGN91.4 billion in 2025.
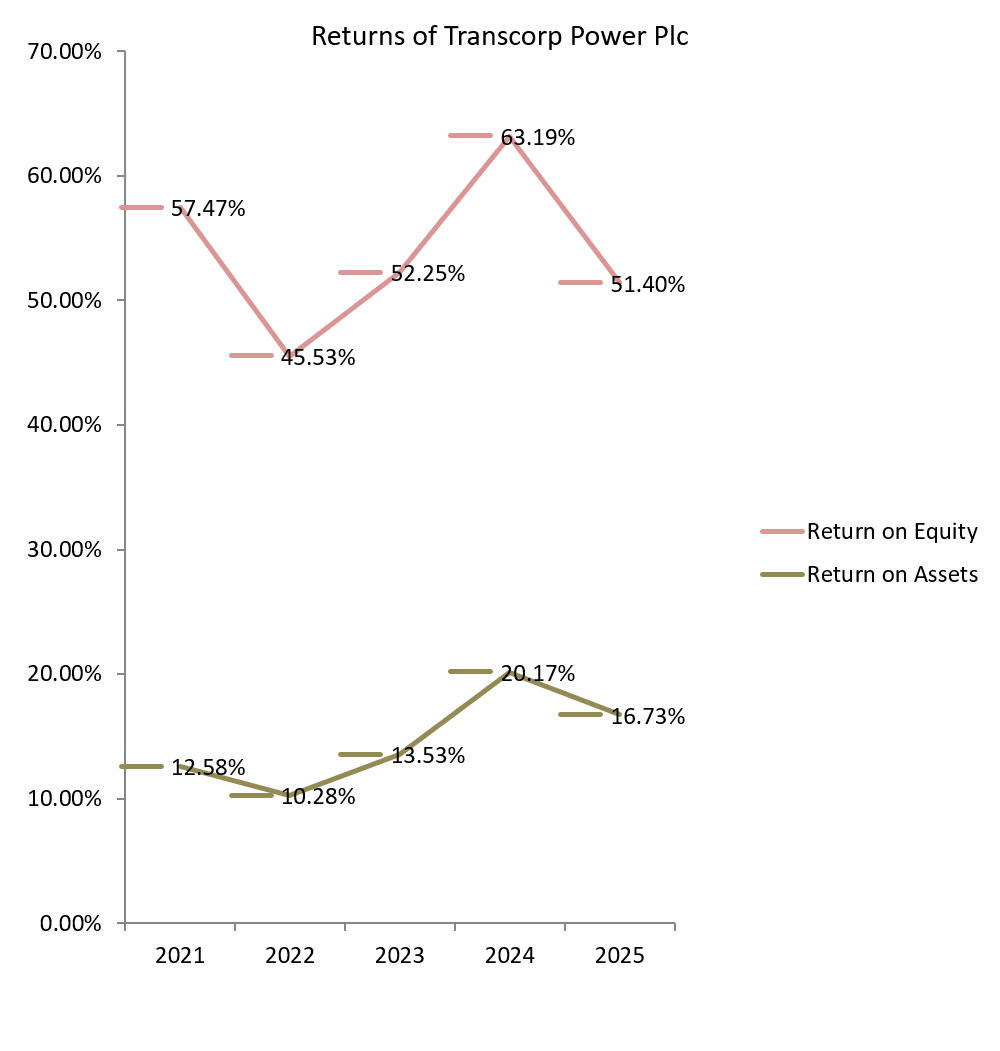
Profit margins dropped owing to a hike in costs. The total costs-to-turnover ratio increased from 62.7% to 68.6%. Operating profit margin, as a result, declined from 37.3% in 2024 to 31.4% in 2025, shedding 15.8%. Net income margin decreased to 23% from 26.2%. Return on Equity (RoE) lost 13.3 percentage points to 49.9%, while Return on Assets (RoA) worsened by 3.9 percentage points to 16.2%.
Trade and other receivables, which have been rising at a 3-Year CAGR of 70.5%. peaked at NGN468.4 billion at the end of the 2025 fiscal year. Trade and other receivables accounted for 83.1% of total assets (2024: 75.2%). TRANSPOWER’s total debt has been decreasing. It closed at NGN30.7 billion at 2025 year-end, dropping 18.4% year-on-year. Only 20% of total debt is short-term in nature, while the rest is long-term. Total debt as a percentage of total equity has fallen from 29.7% in 2024 to 16.7%, while total debt to total assets shed 4 percentage points. It produced adequate operating profit and operating cash flow to meet its interest expense. Operating profit covered interest expense 11.7 times in 2025 (2024: 11.6 times), while operating cash flow could pay interest expense 5.3 times in 2025 (2024: 5.6 times).
Business Risk
TRANSPOWER has to comply with regulations in more than one country. For example, it may be difficult for the company to unilaterally raise its price to maintain its profit margins as a result of rising costs. Also, the company is susceptible to exchange rate fluctuations due to the importation of equipment and export sales.
Recommendation: underpriced
| (NGN in Millions) | 2025 | 2024 | 2023 | 2022 | 2021 |
| Turnover | 398,268 | 305,944 | 142,122 | 90,349 | 74,331 |
| Year-on-Year Change | 30.2% | 115.3% | 57.3% | 21.6% | 14.2% |
| Operating Profit | 125,051 | 114,031 | 64,625 | 35,870 | 29,845 |
| Year-on-Year Change | 9.7% | 76.5% | 80.2% | 20.2% | 48.6% |
| EBITDA | 130,583 | 118,932 | 69,382 | 39,342 | 33,250 |
| Year-on-Year Change | 9.8% | 71.4% | 76.4% | 18.3% | 43.4% |
| PBT | 120,018 | 113,287 | 52,764 | 28,619 | 23,090 |
| Year-on-Year Change | 5.9% | 114.7% | 84.4% | 23.9% | 92.5% |
| PAT | 91,417 | 80,013 | 30,234 | 17,283 | 19,543 |
| Year-on-Year Change | 14.3% | 164.7% | 74.9% | -11.6% | 69.6% |
| Total Assets | 563,479 | 396,782 | 223,391 | 168,187 | 155,414 |
| Year-on-Year Change | 42.0% | 77.6% | 32.8% | 8.2% | 1.6% |
| Net Current Assets | 121,985 | 79,282 | 26,759 | 6,375 | -11,322 |
| Year-on-Year Change | 53.9% | 196.3% | 319.8% | -156.3% | -155.9% |
| Total Equity | 183,399 | 126,626 | 57,862 | 37,964 | 34,006 |
| Year-on-Year Change | 44.8% | 118.8% | 52.4% | 11.6% | 38.6% |
| Capital Expenditure | 2,702 | 8,654 | 4,883 | 4,327 | 8,060 |
| Year-on-Year Change | -68.8% | 77.2% | 12.9% | -46.3% | 1,006.4% |
| Funds from Operations | 56,300 | 54,848 | 38,157 | 21,419 | 39,044 |
| Year-on-Year Change | 2.7% | 43.7% | 78.2% | -45.1% | 228.6% |
| Free Operating Cashflow | 53,598 | 46,194 | 33,274 | 17,092 | 30,983 |
| Year-on-Year Change | 16.0% | 38.8% | 94.7% | -44.8% | 177.8% |
| Total Debt | 30,689 | 37,607 | 37,312 | 43,072 | 44,876 |
| Year-on-Year Change | -18.4% | 0.8% | -13.4% | -4.0% | -21.8% |
| Net Debt | 28,469 | 29,272 | 30,944 | 40,370 | 36,130 |
| Year-on-Year Change | -2.7% | -5.4% | -23.4% | 11.7% | -36.4% |
| Shares Outstanding-ordinary shares (Million) | 7,500 | 7,500 | 328 | 79 | 78 |
| Year-on-Year Change | 0.0% | 2,188.3% | 314.1% | 2.0% | 3.6% |
| Payout Ratio | 45.1% | 46.9% | 3.4% |
| ⇑ – Year-on-Year Increase | Green: ‘Improved’ |
| ⇓ – Year-on-Year Decrease | Red: ‘Worsened’ |
| ⇔ – Year-on-Year Unchanged |
| 2025 | 2024 | 2023 | 2022 | 2021 | |
| CAPITAL STRUCTURE | |||||
| Total Debt/(Total Debt + Equity) | 14.3%⇓ | 22.9%⇓ | 39.2%⇓ | 53.2%⇓ | 56.9%⇓ |
| Net Debt/Equity | 15.5%⇓ | 23.1%⇓ | 53.5%⇓ | 106.3%⇔ | 106.3%⇓ |
| Debt/Total Assets | 5.5%⇓ | 9.5%⇓ | 16.7%⇓ | 25.6%⇓ | 28.9%⇓ |
| Long Term Debt/Net Earnings | 0.3x⇓ | 0.4x⇓ | 1.0x⇓ | 1.7x⇑ | 1.1x⇓ |
| Current Ratio | 1.4x⇑ | 1.3x⇑ | 1.2x⇑ | 1.1x⇑ | 0.9x⇓ |
| Acid Test Ratio | 1.3x⇔ | 1.3x⇑ | 1.2x⇑ | 1.0x⇑ | 0.9x⇓ |
| CASHFLOW RATIOS | |||||
| Funds from Operations/Total Debt | 1.8x⇑ | 1.5x⇑ | 1.0x⇑ | 0.5x⇓ | 0.9x⇑ |
| Funds from Operations/Net Debt | 2.0x⇑ | 1.9x⇑ | 1.2x⇑ | 0.5x⇓ | 1.1x⇑ |
| EBITDA/Interest | 12.2x⇑ | 12.1x⇑ | 9.0x⇔ | 9.0x⇑ | 4.2x⇑ |
| EBIT/Interest | 11.7x⇑ | 11.6x⇑ | 8.4x⇑ | 8.2x⇑ | 3.8x⇑ |
| Net Debt/EBITDA | 0.2x⇓ | 0.3x⇓ | 0.5x⇓ | 1.0x⇓ | 1.1x⇓ |
| Free Operating Cashflow/Interest | 5.0x⇑ | 4.7x⇑ | 4.3x⇑ | 3.9x⇔ | 3.9x⇑ |
| Free Operating Cashflow/Net Debt | 1.9x⇑ | 1.6x⇑ | 1.1x⇑ | 0.4x⇓ | 0.9x⇑ |
| Free Operating Cashflow/Sales | 0.1x⇓ | 0.2x⇔ | 0.2x⇔ | 0.2x⇓ | 0.4x⇑ |
| PROFITABILITY RATIOS | |||||
| Gross Profit Margin | 45.7%⇓ | 46.5%⇓ | 53.1%⇑ | 46.7%⇑ | 46.6%⇑ |
| EBITDA Margin | 32.8%⇓ | 38.9%⇓ | 48.8%⇑ | 43.5%⇓ | 44.7%⇑ |
| EBIT Margin | 31.4%⇓ | 37.3%⇓ | 45.5%⇑ | 39.7%⇓ | 40.2%⇑ |
| PBT Margin | 30.1%⇓ | 37.0%⇓ | 37.1%⇑ | 31.7%⇑ | 31.1%⇑ |
| PAT Margin | 23.0%⇓ | 26.2%⇑ | 21.3%⇑ | 19.1%⇓ | 26.3%⇑ |
| ROAE | 60.8%⇓ | 86.7%⇑ | 63.1%⇑ | 48.0%⇓ | 66.8%⇑ |
| ROAA | 19.6%⇓ | 25.8%⇑ | 15.4%⇑ | 10.7%⇓ | 12.7%⇑ |