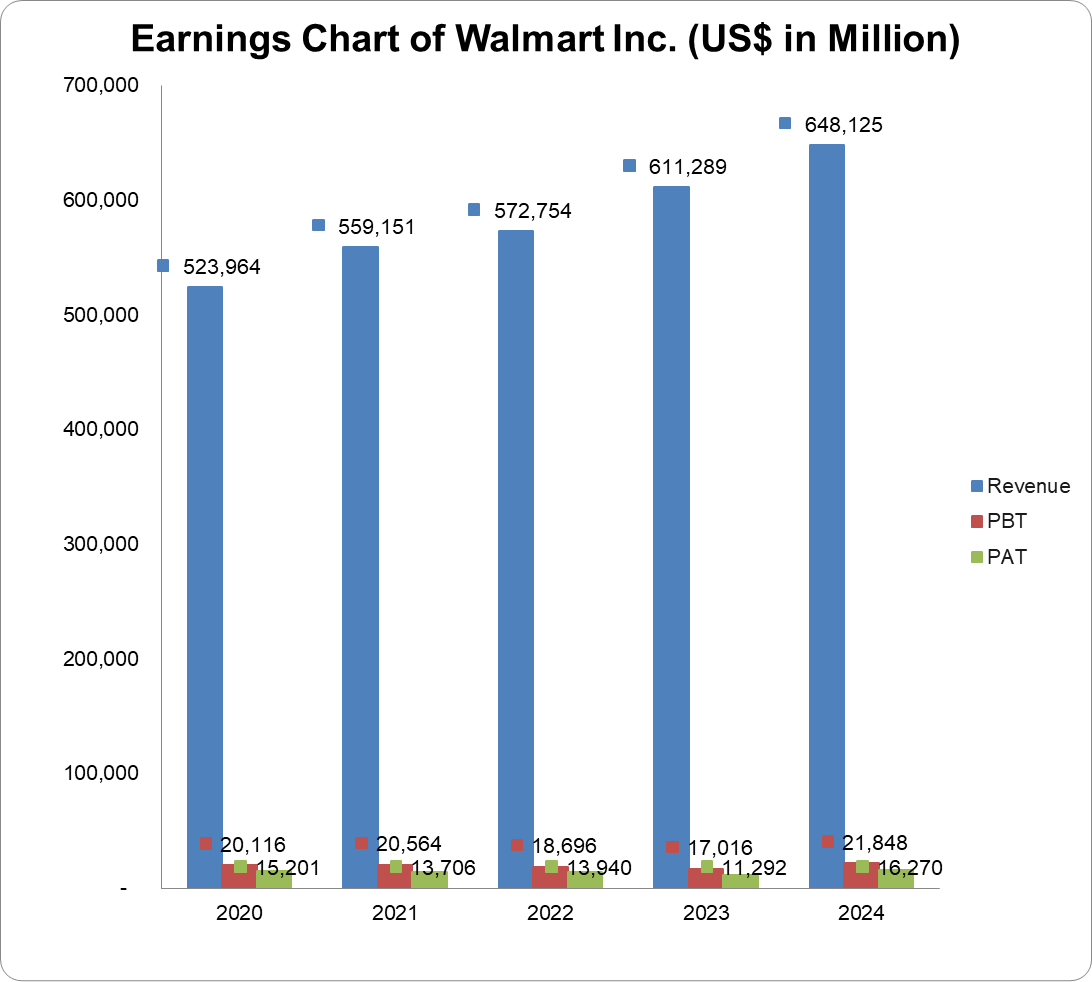
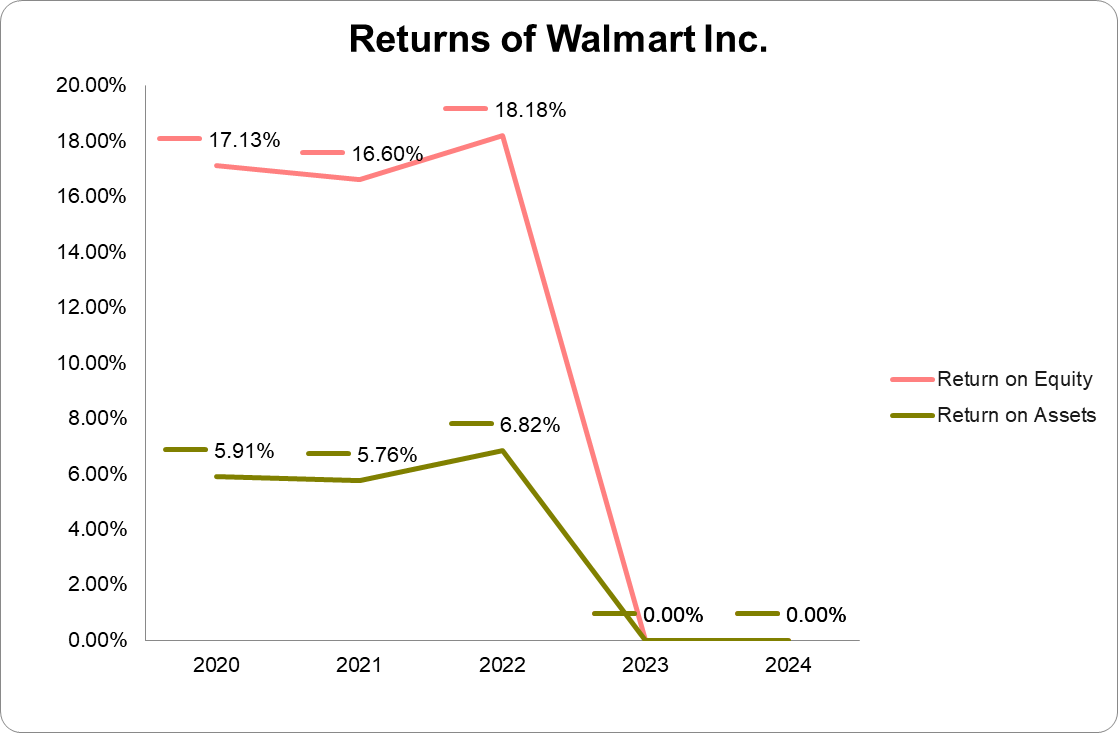
| (US$ in Million) | 2024 | 2023 | 2022 | 2021 | 2020 |
| Turnover | 648,125 | 641,289 | 572,754 | 559,151 | 523,964 |
| Year-on-Year Change | 6.0% | 6.7% | 2.4% | 6.7% | 1.9% |
| Operating Profit | 27,012 | 20,428 | 25,942 | 22,548 | 20,568 |
| Year-on-Year Change | 32.2% | -21.3% | 15.1% | 9.6% | -6.3% |
| EBITDA | 38,865 | 31,373 | 36,600 | 33,700 | 31,555 |
| Year-on-Year Change | 23.9% | -14.3% | 8.6% | 6.8% | -3.3% |
| PBT | 21,848 | 17,016 | 18,696 | 20,564 | 20,116 |
| Year-on-Year Change | 28.4% | -9.0% | -9.1% | 2.2% | 75.5% |
| PAT | 16,270 | 11,292 | 13,940 | 13,706 | 15,201 |
| Year-on-Year Change | 44.1% | -19.0% | 1.7% | -9.8% | 111.7% |
| Total Assets | 252,399 | 243,197 | 244,860 | 252,496 | 236,495 |
| Year-on-Year Change | 3.8% | -0.7% | -3.0% | 6.8% | 7.8% |
| Net Current Assets | -15,538 | -16,543 | -6,309 | -2,578 | -15,984 |
| Year-on-Year Change | -6.1% | 162.2% | 144.7% | -83.9% | 2.6% |
| Total Equity | 90,349 | 83,754 | 91,891 | 87,531 | 81,552 |
| Year-on-Year Change | 7.9% | -8.9% | 5.0% | 7.3% | 2.4% |
| Capital Expenditure | 20,615 | 17,597 | 13,465 | 10,444 | 10,761 |
| Year-on-Year Change | 17.2% | 30.7% | 28.9% | -3.0% | -57.0% |
| Funds from Operations | 35,726 | 28,841 | 24,181 | 36,074 | 25,255 |
| Year-on-Year Change | 23.9% | 19.3% | -33.0% | 42.8% | -9.0% |
| Free Operating Cashflow | 15,111 | 11,244 | 10,716 | 25,630 | 14,494 |
| Year-on-Year Change | 34.4% | 4.9% | -58.2% | 76.8% | 426.5% |
| Total Debt | 61,321 | 58,923 | 57,323 | 63,246 | 72,433 |
| Year-on-Year Change | 4.1% | 2.8% | -9.4% | -12.7% | 24.8% |
| Net Debt | 51,454 | 50,298 | 42,563 | 45,505 | 62,968 |
| Year-on-Year Change | 2.3% | 18.2% | -6.5% | -27.7% | 25.2% |
| Shares Outstanding (Million) | 8,077 | 8,171 | 8,376 | 2,831 | 2,850 |
| Year-on-Year Change | -1.2% | -2.5% | 195.9% | -0.7% | -2.7% |
| Payout Ratio | 35.7% | 66.1% | 36.8% | 42.1% | 43.3% |
| ⇑ – Year-on-Year Increase | Green: ‘Improved’ |
| ⇓ – Year-on-Year Decrease | Red: ‘Worsened’ |
| ⇔ – Year-on-Year Unchanged |
| 2024 | 2023 | 2022 | 2021 | 2020 | |
| CAPITAL STRUCTURE | |||||
| Total Debt/(Total Debt + Equity) | 40.4%⇓ | 41.3%⇑ | 38.4%⇓ | 42.0%⇓ | 47.0%⇑ |
| Net Debt/Equity | 57.0%⇓ | 60.1%⇑ | 46.3%⇓ | 52.0%⇓ | 77.2%⇑ |
| Debt/Total Assets | 24.3%⇑ | 24.2%⇑ | 23.4%⇓ | 25.1%⇓ | 30.6%⇑ |
| Long Term Debt/Net Earnings | 3.5x⇓ | 5.2x⇑ | 3.1x⇓ | 4.0x⇓ | 4.7x⇓ |
| Current Ratio | 0.8x⇔ | 0.8x⇓ | 0.9x⇓ | 1.0x⇑ | 0.8x⇔ |
| Acid Test Ratio | 0.2x⇔ | 0.2x⇓ | 0.3x⇓ | 0.5x⇑ | 0.2x⇔ |
| CASHFLOW RATIOS | |||||
| Funds from Operations/Total Debt | 0.6x⇑ | 0.5x⇑ | 0.4x⇓ | 0.6x⇑ | 0.4x⇓ |
| Funds from Operations/Net Debt | 0.7x⇑ | 0.6x⇔ | 0.6x⇓ | 0.8x⇑ | 0.4x⇓ |
| EBITDA/Interest | 14.5x⇓ | 14.7x⇓ | 18.4x⇑ | 14.6x⇑ | 12.1x⇓ |
| EBIT/Interest | 10.1x⇑ | 9.6x⇓ | 13.0x⇑ | 9.7x⇑ | 7.9x⇓ |
| Net Debt/EBITDA | 1.3x⇓ | 1.6x⇑ | 1.2x⇓ | 1.4x⇓ | 2.0x⇑ |
| Free Operating Cashflow/Interest | 5.6x⇑ | 5.3x⇓ | 5.4x⇓ | 11.1x⇑ | 5.6x⇑ |
| Free Operating Cashflow/Net Debt | 0.3x⇑ | 0.2x⇓ | 0.3x⇓ | 0.6x⇑ | 0.2x⇑ |
| Free Operating Cashflow/Sales | 0.0x⇔ | 0.0x⇔ | 0.0x⇓ | 0.1x⇑ | 0.ox⇔ |
| PROFITABILITY RATIOS | |||||
| Gross Profit Margin | 24.4%⇑ | 24.1%⇓ | 25.1%⇑ | 24.8%⇑ | 24.7%⇓ |
| EBITDA Margin | 6.0%⇑ | 5.1%⇓ | 6.4%⇑ | 6.0%⇔ | 6.0%⇓ |
| EBIT Margin | 4.2%⇑ | 3.3%⇓ | 4.5%⇑ | 4.0%⇑ | 3.9%⇓ |
| PBT Margin | 3.4%⇑ | 2.8%⇓ | 3.3%⇓ | 3.7%⇓ | 3.8%⇑ |
| PAT Margin | 2.5%⇑ | 1.9%⇓ | 2.4%⇓ | 2.5%⇓ | 2.9%⇑ |
| ROAE | 19.8%⇑ | 10.5%⇓ | 18.6%⇑ | 17.2%⇓ | 17.3%⇓ |
| ROAA | 7.0%⇑ | 3.8%⇓ | 6.7%⇑ | 5.9%⇓ | 6.1%⇓ |