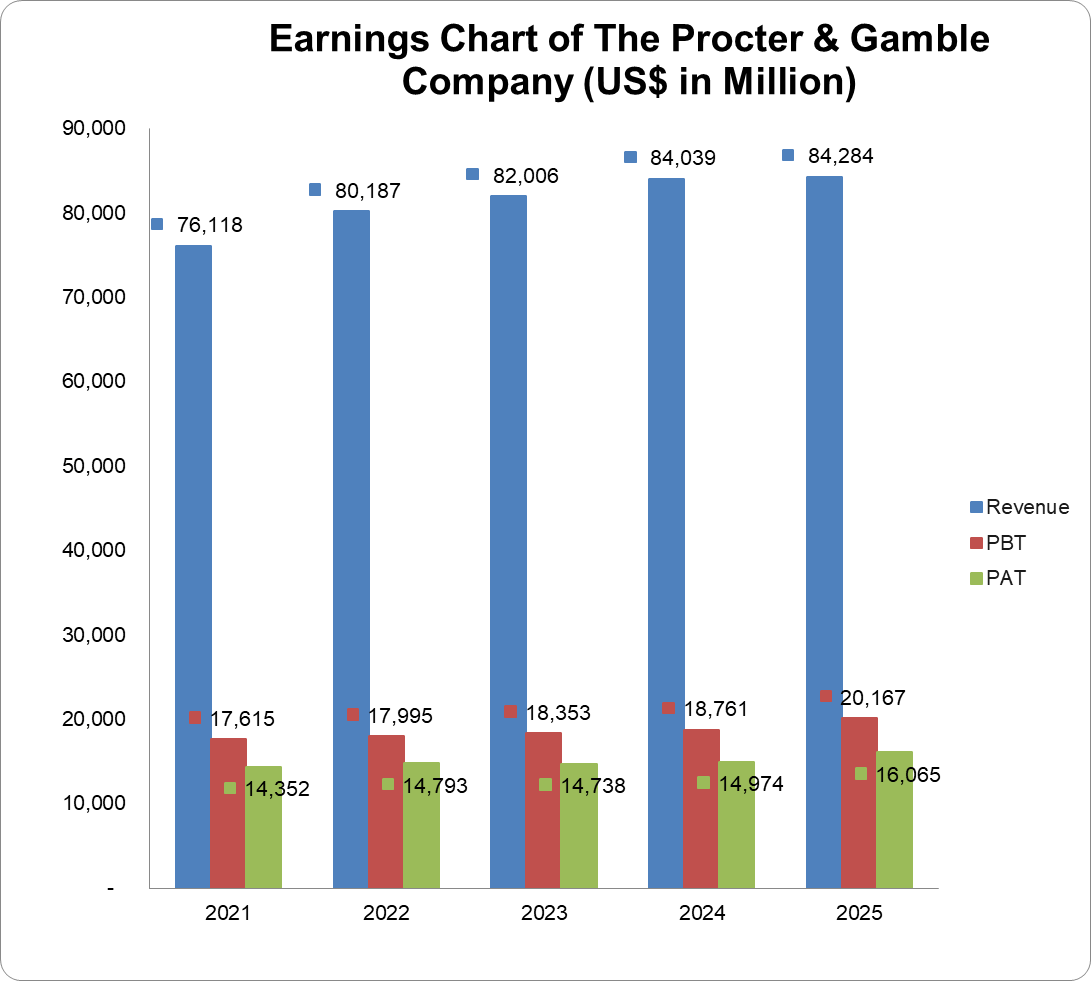
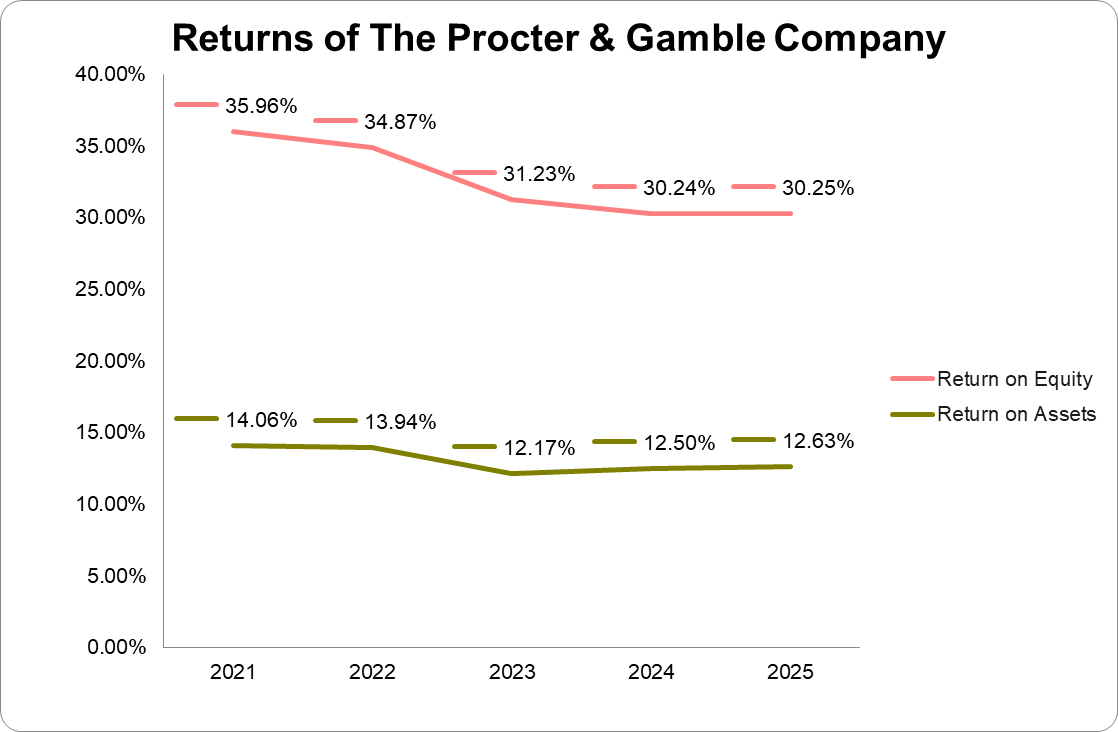
| (US$ in Million) | 2025 | 2024 | 2023 | 2022 | 2021 |
| Turnover | 84,284 | 84,039 | 82,006 | 80,187 | 76,118 |
| Year-on-Year Change | 0.3% | 2.5% | 2.3% | 5.4% | 7.3% |
| Operating Profit | 20,451 | 18,545 | 18,134 | 17,813 | 17,986 |
| Year-on-Year Change | 10.3% | 2.3% | 1.8% | -1.0% | 14.5% |
| EBITDA | 23,298 | 21,441 | 20,848 | 20,620 | 20,721 |
| Year-on-Year Change | 8.7% | 2.8% | 1.1% | -0.5% | 10.7% |
| PBT | 20,167 | 18,761 | 18,353 | 17,995 | 17,615 |
| Year-on-Year Change | 7.5% | 2.2% | 2.0% | 2.2% | 11.3% |
| PAT | 16,065 | 14,974 | 14,738 | 14,793 | 14,352 |
| Year-on-Year Change | 7.3% | 1.6% | -0.4% | 3.1% | 9.5% |
| Total Assets | 125,231 | 122,370 | 120,829 | 117,208 | 119,307 |
| Year-on-Year Change | 2.3% | 1.3% | 3.1% | -1.8% | -1.2% |
| Net Current Assets | -10,666 | -8,918 | -13,108 | -11,428 | -10,041 |
| Year-on-Year Change | 19.6% | -32.0% | 14.7% | 13.8% | 101.3% |
| Total Equity | 52,284 | 50,559 | 47,065 | 46,854 | 46,654 |
| Year-on-Year Change | 3.4% | 7.4% | 0.5% | 0.4% | -0.5% |
| Capital Expenditure | 3,784 | 3,343 | 3,827 | 4,537 | 2,821 |
| Year-on-Year Change | 13.2% | -12.7% | -15.7% | 60.8% | -9.9% |
| Funds from Operations | 17,817 | 19,846 | 16,848 | 16,723 | 18,371 |
| Year-on-Year Change | -10.2% | 17.8% | 0.8% | -9.0% | 5.6% |
| Free Operating Cashflow | 14,033 | 16,503 | 13,021 | 12,186 | 15,550 |
| Year-on-Year Change | -15.0% | 26.7% | 6.9% | -21.6% | 9.0% |
| Total Debt | 34,508 | 32,460 | 34,607 | 31,493 | 31,988 |
| Year-on-Year Change | 6.3% | -6.2% | 9.9% | -1.6% | -7.9% |
| Net Debt | 24,952 | 22,978 | 26,361 | 24,279 | 21,700 |
| Year-on-Year Change | 8.6% | -12.8% | 8.6% | 11.9% | 17.1% |
| Shares Outstanding (Million) | 2,350 | 2,360 | 2,368 | 2,410 | 2,466 |
| Year-on-Year Change | -0.4% | -0.3% | -1.8% | -2.3% | -0.9% |
| Payout Ratio | 60.6% | 59.1% | 59.3% | 52.0% | 47.7% |
| ⇑ – Year-on-Year Increase | Green: ‘Improved’ |
| ⇓ – Year-on-Year Decrease | Red: ‘Worsened’ |
| ⇔ – Year-on-Year Unchanged |
| 2025 | 2024 | 2023 | 2022 | 2021 | |
| CAPITAL STRUCTURE | |||||
| Total Debt/(Total Debt + Equity) | 39.8%⇑ | 39.1%⇓ | 42.4%⇑ | 40.2%⇓ | 40.7%⇓ |
| Net Debt/Equity | 47.7%⇑ | 45.5%⇓ | 56.0%⇑ | 51.8%⇑ | 46.5%⇑ |
| Debt/Total Assets | 27.6%⇑ | 26.5%⇓ | 28.6%⇑ | 26.9%⇑ | 26.8%⇓ |
| Long Term Debt/Net Earnings | 1.6x⇓ | 1.7x⇔ | 1.7x⇑ | 1.4x⇔ | 1.4x⇔ |
| Current Ratio | 0.7x⇔ | 0.7x⇑ | 0.6x⇓ | 0.7x⇔ | 0.7x⇓ |
| Acid Test Ratio | 0.5x⇔ | 0.5x⇑ | 0.4x⇓ | 0.5x⇔ | 0.5x⇓ |
| CASHFLOW RATIOS | |||||
| Funds from Operations/Total Debt | 0.5x⇓ | 0.6x⇑ | 0.5x⇔ | 0.5x⇓ | 0.6x⇑ |
| Funds from Operations/Net Debt | 0.7x⇓ | 0.9x⇑ | 0.6x⇓ | 0.7x⇓ | 0.9x⇔ |
| EBITDA/Interest | 25.7x⇑ | 23.2x⇓ | 27.6x⇓ | 47.0x⇑ | 41.3x⇑ |
| EBIT/Interest | 22.6x⇑ | 20.1x⇓ | 24.0x⇓ | 40.6x⇑ | 35.8x⇑ |
| Net Debt/EBITDA | 1.1x⇔ | 1.1x⇓ | 1.3x⇑ | 1.2x⇑ | 1.1x⇑ |
| Free Operating Cashflow/Interest | 15.5x⇓ | 17.8x⇑ | 17.2x⇓ | 27.8x⇓ | 31.0x⇑ |
| Free Operating Cashflow/Net Debt | 0.6x⇓ | 0.7x⇑ | 0.5x⇔ | 0.5x⇓ | 0.7x⇓ |
| Free Operating Cashflow/Sales | 0.2x | 0.2x⇔ | 0.2x⇔ | o.2x⇔ | 0.2x⇔ |
| PROFITABILITY RATIOS | |||||
| Gross Profit Margin | 51.2%⇓ | 51.4%⇑ | 47.9%⇑ | 47.4%⇓ | 51.3%⇑ |
| EBITDA Margin | 27.6%⇑ | 25.5%⇑ | 25.4%⇓ | 25.7%⇓ | 27.2%⇑ |
| EBIT Margin | 24.3%⇑ | 22.1%⇔ | 22.1%⇓ | 22.2%⇓ | 23.6%⇑ |
| PBT Margin | 23.9%⇑ | 22.3%⇓ | 22.4% | 22.4%⇓ | 23.1%⇑ |
| PAT Margin | 19.1%⇑ | 17.8%⇓ | 18.0%⇓ | 18.5%⇓ | 18.9%⇑ |
| ROAE | 30.8%⇓ | 31.3%⇔ | 31.3%⇓ | 35.0%⇓ | 35.9%⇓ |
| ROAA | 12.8%⇑ | 12.6%⇑ | 12.4%⇓ | 13.8%⇓ | 14.0%⇓ |