| (US$ in Million) | 2024 | 2023 | 2022 | 2021 | 2020 |
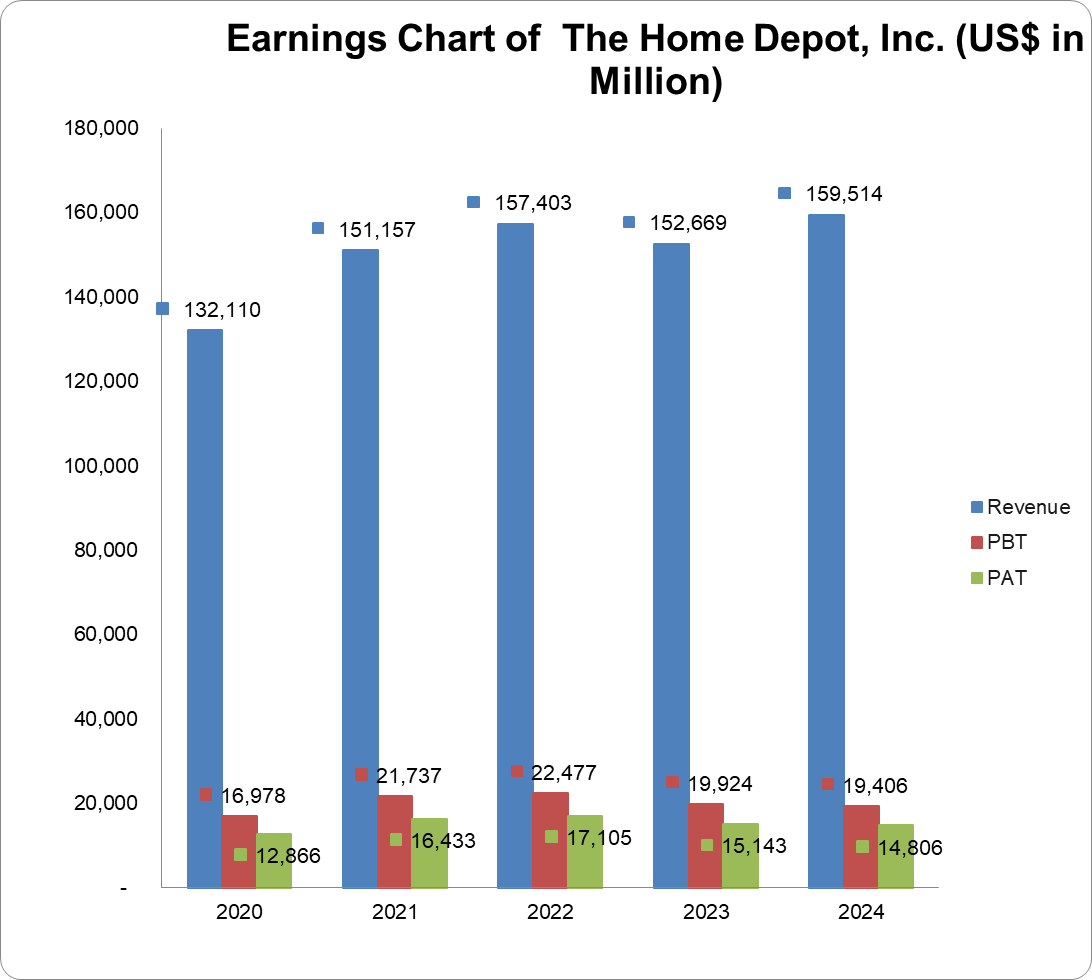
| Turnover | 159,514 | 152,669 | 157,403 | 151,157 | 132,110 |
| Year-on-Year Change | 4.5% | -3.0% | 4.1% | 14.4% | 19.9% |
| Operating Profit | 21,526 | 21,689 | 24,039 | 23,040 | 18,278 |
| Year-on-Year Change | -0.8% | -9.8% | 4.3% | 26.1% | 15.4% |
| EBITDA | 24,560 | 24,362 | 26,494 | 25,426 | 20,406 |
| Year-on-Year Change | 0.8% | -8.1% | 4.2% | 24.6% | 14.4% |
| PBT | 19,406 | 19,924 | 22,477 | 21,737 | 16,978 |
| Year-on-Year Change | -2.6% | -11.4% | 3.4% | 28.0% | 15.4% |
| PAT | 14,806 | 15,143 | 17,105 | 16,433 | 12,866 |
| Year-on-Year Change | -2.2% | -11.55 | 4.1% | 27.7% | 14.5% |
| Total Assets | 96,119 | 76,530 | 76,445 | 71,876 | 70,581 |
| Year-on-Year Change | 25.6% | 0.1% | 6.4% | 1.8% | 37.8% |
| Net Current Assets | 3,022 | 7,760 | 9,361 | 362 | 5,311 |
| Year-on-Year Change | -61.1% | -17.1% | 2,485.9% | -93.2% | 270.1% |
| Total Equity | 6,640 | 1,044 | 1,562 | -1,696 | 3,299 |
| Year-on-Year Change | 536.0% | -33.2% | -192.1% | -151.4% | -205.9% |
| Capital Expenditure | 21,129 | 4,740 | 3,119 | 2,987 | 10,243 |
| Year-on-Year Change | 345.8% | 52.0% | 4.4% | -70.8% | 282.5% |
| Funds from Operations | 19,810 | 21,172 | 14,615 | 16,571 | 18,839 |
| Year-on-Year Change | -6.4% | 44.9% | -11.8% | -12.0% | 37.6% |
| Free Operating Cashflow | -1,319 | 16,432 | 11,496 | 13,584 | 8,596 |
| Year-on-Year Change | -108.0% | 42.9% | -15.4% | 58.0% | -21.9% |
| Total Debt | 62,290 | 52,243 | 50,364 | 46,269 | 43,422 |
| Year-on-Year Change | 19.2% | 3.7% | 8.9% | 6.6% | 16.2% |
| Net Debt | 60,631 | 48,483 | 47,607 | 43,926 | 35,527 |
| Year-on-Year Change | 25.1% | 1.8% | 8.4% | 23.6% | 0.8% |
| Shares Outstanding (Million) | 990 | 999 | 1,022 | 1,054 | 1,074 |
| Year-on-Year Change | -0.9% | -2.3% | -3.0% | -1.9% | -1.7% |
| Payout Ratio | 63.0% | 54.3% | 45.5% | 42.4% | 49.8% |
| ⇑ – Year-on-Year Increase | Green: ‘Improved’ |
| ⇓ – Year-on-Year Decrease | Red: ‘Worsened’ |
| ⇔ – Year-on-Year Unchanged |
| 2024 | 2023 | 2022 | 2021 | 2020 | |
| CAPITAL STRUCTURE | |||||
| Total Debt/(Total Debt + Equity) | 90.4%⇓ | 98.0%⇑ | 97.0%⇓ | 103.8%⇑ | 92.9%⇓ |
| Net Debt/Equity | 913.1%⇓ | 4,644.0%⇑ | 3,047.8%⇑ | -2,590.0%⇓ | 1,076.9%⇑ |
| Debt/Total Assets | 64.8%⇓ | 68.3%⇑ | 65.9%⇑ | 64.4%⇑ | 61.5%⇓ |
| Long Term Debt/Net Earnings | 4.0x⇑ | 3.2x⇑ | 2.8x⇑ | 2.6x⇓ | 3.2x⇑ |
| Current Ratio | 1.1x⇓ | 1.4x⇔ | 1.4x⇑ | 1.0x⇓ | 1.2x⇑ |
| Acid Test Ratio | 0.3x⇓ | 0.4x⇑ | 0.3x⇑ | 0.2x⇓ | 0.5x⇑ |
| CASHFLOW RATIOS | |||||
| Funds from Operations/Total Debt | 0.3x⇓ | 0.4x⇑ | 0.3x⇓ | 0.4x⇔ | 0.4x⇔ |
| Funds from Operations/Net Debt | 0.3x⇓ | 0.4x⇑ | 0.3x⇓ | 0.4x⇓ | 0.5x⇑ |
| EBITDA/Interest | 10.6x⇓ | 12.5x⇓ | 16.4x⇓ | 18.9x⇑ | 15.2x⇑ |
| EBIT/Interest | 9.3x⇓ | 11.2x⇓ | 14.9x⇓ | 17.1x⇑ | 13.6x⇑ |
| Net Debt/EBITDA | 2.5x⇑ | 2.0x⇑ | 1.8x⇑ | 1.7x⇔ | 1.7x⇓ |
| Free Operating Cashflow/Interest | -0.6x⇓ | 8.5x⇑ | 7.1x⇓ | 10.1x⇑ | 6.4x⇓ |
| Free Operating Cashflow/Net Debt | 0.0x⇓ | 0.3x⇑ | 0.2x⇓ | 0.3x⇑ | 0.2x⇓ |
| Free Operating Cashflow/Sales | 0.0x⇓ | 0.1x⇔ | 0.1x⇔ | 0.1x⇔ | 0.1x⇔ |
| PROFITABILITY RATIOS | |||||
| Gross Profit Margin | 33.4%⇔ | 33.4%⇓ | 33.5%⇓ | 33.6%⇓ | 34.0%⇓ |
| EBITDA Margin | 15.4%⇓ | 16.0%⇓ | 16.8%⇔ | 16.8%⇑ | 15.5%⇓ |
| EBIT Margin | 13.5%⇓ | 14.2%⇓ | 15.3%⇑ | 15.2%⇑ | 13.8%⇓ |
| PBT Margin | 12.2%⇓ | 13.1%⇓ | 14.3%⇓ | 14.4%⇑ | 12.9%⇓ |
| PAT Margin | 9.3%⇓ | 9.9%⇓ | 10.9%⇔ | 10.9%⇑ | 9.7%⇓ |
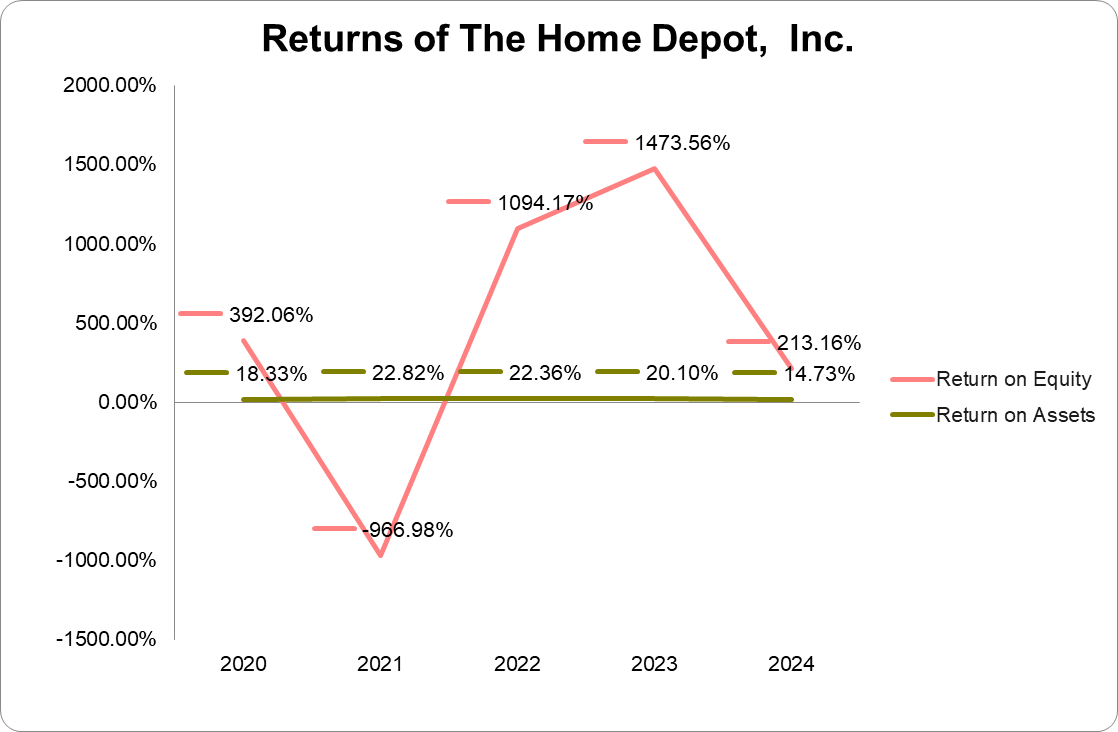
| ROAE | 368.4%⇓ | 1,180.7%⇑ | -25,509.0%⇓ | 2,046.2%⇓ | 14,135.5%⇑ |
| ROAA | 16.4%⇓ | 20.1%⇓ | 23.1%⇑ | 23.0%⇑ | 21.2%⇓ |