| (£ in Million) | 2025 | 2024 | 2023 | 2022 | 2021 |
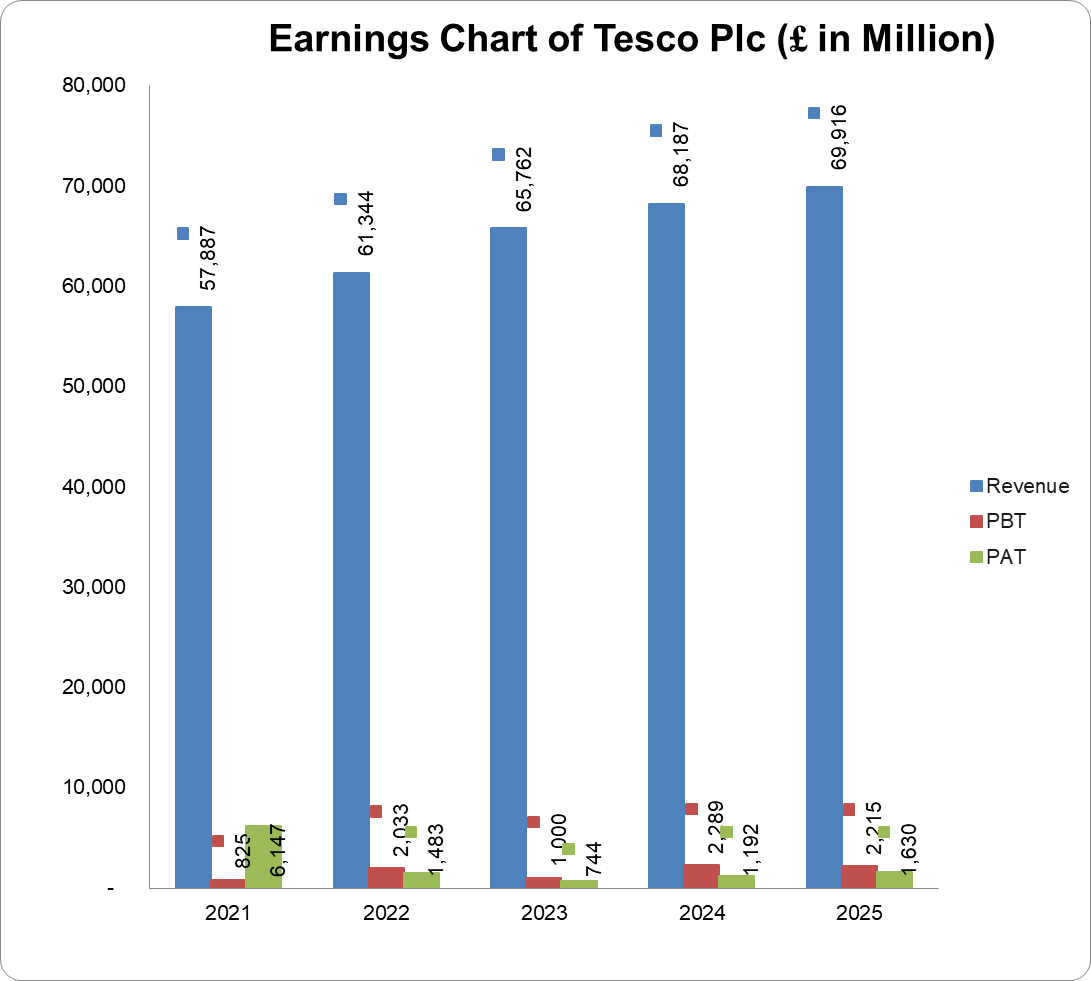
| Turnover | 69,916 | 68,187 | 65,762 | 61,344 | 57,887 |
| Year-on-Year Change | 2.5% | 3.7% | 7.2% | 6.0% | -0.4% |
| Operating Profit | 2,711 | 2,821 | 1,525 | 2,560 | 1,736 |
| Year-on-Year Change | -3.9% | 85.0% | -40.4% | 47.5% | -21.3% |
| EBITDA | 4,486 | 4,544 | 3,225 | 4,278 | 3,503 |
| Year-on-Year Change | -1.3% | 40.9% | -24.6% | 22.1% | -19.7% |
| PBT | 2,215 | 2,289 | 1,000 | 2,033 | 825 |
| Year-on-Year Change | -3.2% | 128.9% | -50.8% | 146.4% | -19.8% |
| PAT | 1,630 | 1,192 | 744 | 1,483 | 6,147 |
| Year-on-Year Change | 36.7% | 60.2% | -49.8% | -75.9% | 531.8% |
| Total Assets | 38,890 | 47,039 | 46,132 | 49,351 | 45,778 |
| Year-on-Year Change | -17.3% | 2.0% | -6.5% | 7.8% | -13.9% |
| Net Current Assets | -4,964 | -3,866 | -5,010 | -3,950 | -5,190 |
| Year-on-Year Change | 28.4% | -22.8% | 26.8% | -23.9% | 9.0% |
| Total Equity | 11,662 | 11,665 | 12,230 | 15,644 | 12,325 |
| Year-on-Year Change | 0.0% | -4.6% | -21.8% | 26.9% | -7.8% |
| Capital Expenditure | 1,585 | 1,403 | 1,321 | 1,226 | 1,392 |
| Year-on-Year Change | 13.0% | 6.2% | 7.8% | -11.9% | 15.6% |
| Funds from Operations | 2,922 | 3,839 | 3,722 | 3,757 | 602 |
| Year-on-Year Change | -23.9% | 3.1% | -0.9% | 524.1% | 1.154.2% |
| Free Operating Cashflow | 1,337 | 2,436 | 2,401 | 2,531 | -790 |
| Year-on-Year Change | -45.1% | 1.5% | -5.1% | 420.4% | -31.7% |
| Total Debt | 14,666 | 14,841 | 15,078 | 15,357 | 15,670 |
| Year-on-Year Change | -1.2% | -1.6% | -1.8% | -2.0% | -11.9% |
| Net Debt | 12,411 | 12,501 | 12,613 | 13,012 | 13,160 |
| Year-on-Year Change | -0.7% | -0.9% | -3.1% | -1.1% | -3.6% |
| Shares Outstanding (Million) | 6,835 | 7,097 | 7,415 | 7,658 | 9,629 |
| Year-on-Year Change | -3.7% | -4.3% | -3.2% | -20.5% | -0.9% |
| Payout Ratio | 50.3% | 104.1% | -49.5% | 17.9% | 117.7% |
| ⇑ – Year-on-Year Increase | Green: ‘Improved’ |
| ⇓ – Year-on-Year Decrease | Red: ‘Worsened’ |
| ⇔ – Year-on-Year Unchanged |
| 2025 | 2024 | 2023 | 2022 | 2021 | |
| CAPITAL STRUCTURE | |||||
| Total Debt/(Total Debt + Equity) | 55.7%⇓ | 56.0%⇑ | 55.2%⇑ | 49.5%⇓ | 56.0%⇓ |
| Net Debt/Equity | 106.4%⇓ | 107.2%⇑ | 103.1%⇑ | 83.2%⇓ | 106.8%⇑ |
| Debt/Total Assets | 37.7%⇑ | 31.6%⇓ | 32.7%⇑ | 31.1%⇓ | 34.2%⇓ |
| Long Term Debt/Net Earnings | 6.6x⇓ | 15.4x⇑ | -7.8x⇓ | 3.0x⇑ | 2.9x⇓ |
| Current Ratio | 0.6x⇓ | 0.8x⇑ | 0.7x⇓ | 0.8x⇑ | 0.7x⇓ |
| Acid Test Ratio | 0.4x⇓ | 0.7x⇑ | 0.6x⇔ | 0.6x⇔ | 0.6x⇓ |
| CASHFLOW RATIOS | |||||
| Funds from Operations/Total Debt | 0.2x⇓ | 0.3x⇔ | 0.3x⇑ | 0.2x⇑ | 0.0x⇔ |
| Funds from Operations/Net Debt | 0.2x⇓ | 0.3x⇔ | 0.3x⇔ | 0.3x⇑ | 0.1x⇓ |
| EBITDA/Interest | 6.0x⇑ | 5.6x⇑ | 5.2x⇓ | 7.8x⇑ | 3.7x⇑ |
| EBIT/Interest | 3.6x⇑ | 3.5x⇑ | 2.5x⇓ | 4.7x⇑ | 1.8x⇓ |
| Net Debt/EBITDA | 2.8x⇔ | 2.8x⇓ | 3.9x⇑ | 3.0x⇓ | 3.8x⇑ |
| Free Operating Cashflow/Interest | 1.8x⇓ | 3.0x⇓ | 3.9x⇑ | 4.6x⇑ | -0.8x⇓ |
| Free Operating Cashflow/Net Debt | 0.1x⇓ | 0.2x⇔ | 0.2x⇔ | 0.2x⇑ | -0.1x⇓ |
| Free Operating Cashflow/Sales | 0.0x⇔ | 0.0x⇔ | 0.0x⇔ | 0.0x⇓ | 0.1⇑ |
| PROFITABILITY RATIOS | |||||
| Gross Profit Margin | 7.2%⇑ | 7.1%⇑ | 5.6%⇓ | 7.6%⇑ | 6.9%⇓ |
| EBITDA Margin | 6.4%⇓ | 6.7%⇑ | 4.9%⇓ | 7.0%⇑ | 6.1%⇓ |
| EBIT Margin | 3.9%⇓ | 4.1%⇑ | 2.3%⇓ | 4.2%⇑ | 3.0%⇓ |
| PBT Margin | 3.2%⇓ | 3.4%⇑ | 1.5%⇓ | 3.3%⇑ | 1.4%⇓ |
| PAT Margin | 2.3%⇑ | 1.8%⇑ | 1.1%⇓ | 2.4%⇓ | 10.6%⇑ |
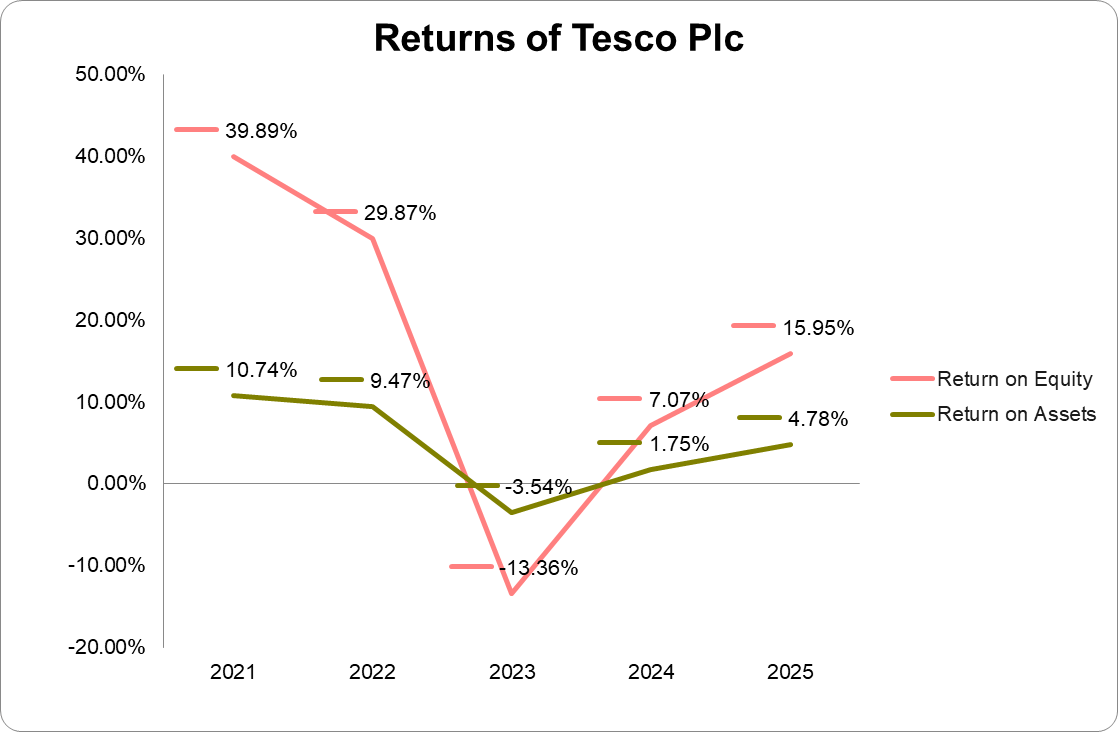
| ROAE | 16.0%⇑ | 6.9%⇑ | -11.7%⇓ | 33.4%⇓ | 38.3%⇑ |
| ROAA | 4.3%⇑ | 1.8%⇓ | -3.4%⇓ | 9.8%⇓ | 9.9%⇑ |