| (US$ in Million) | 2024 | 2023 | 2022 | 2021 | 2020 |
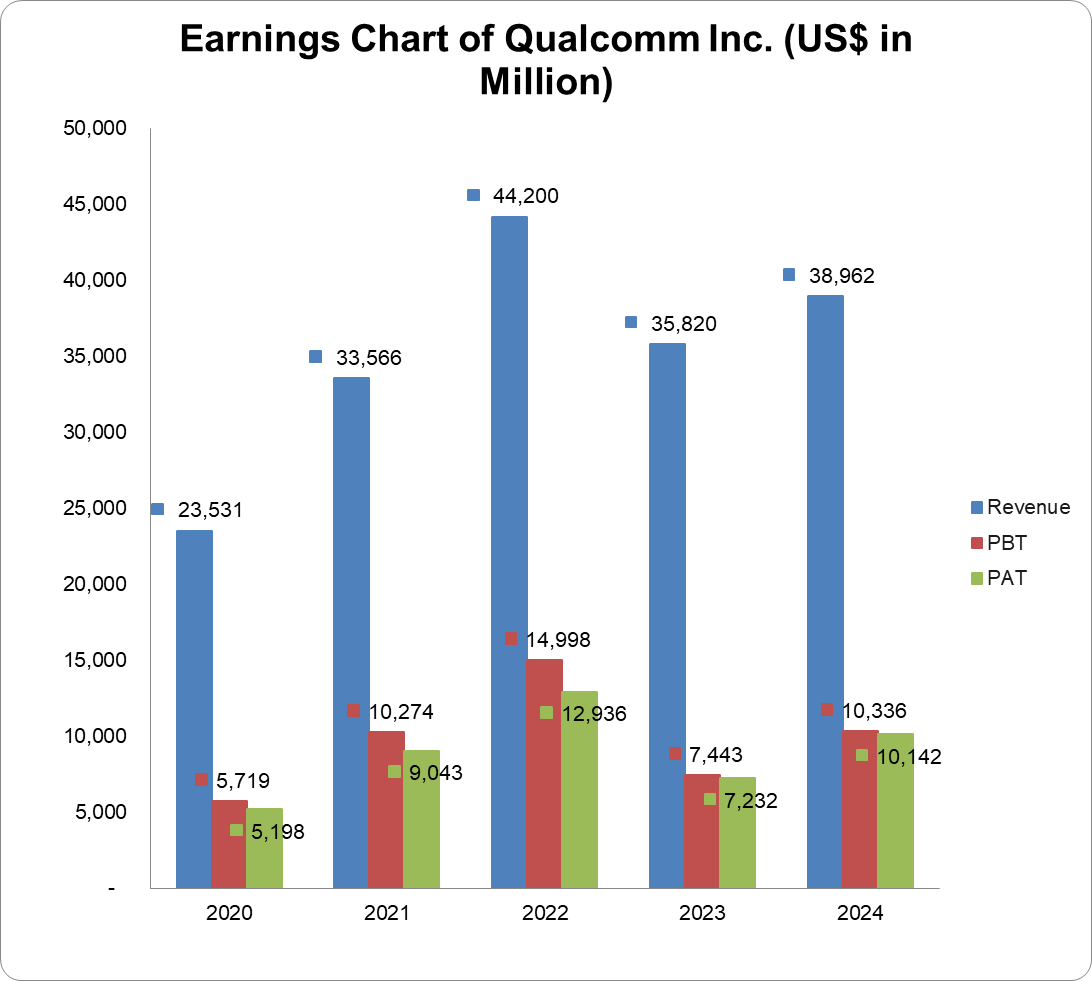
| Turnover | 38,962 | 35,820 | 44,200 | 33,566 | 23,531 |
| Year-on-Year Change | 8.8% | -19.0% | 31.7% | 42.7% | -3.1% |
| Operating Profit | 10,071 | 7,788 | 15,860 | 9,789 | 6,255 |
| Year-on-Year Change | 29.3% | -50.9% | 62.0% | 56.5% | -18.4% |
| EBITDA | 11,777 | 9,597 | 17,622 | 11,371 | 7,648 |
| Year-on-Year Change | 22.7% | -45.5% | 55.0% | 48.7% | -15.7% |
| PBT | 10,336 | 7,443 | 14,998 | 10,274 | 5,719 |
| Year-on-Year Change | 38.9% | -50.4% | 46.0% | 79.7% | -23.6% |
| PAT | 10,142 | 7,232 | 12,936 | 9,043 | 5,198 |
| Year-on-Year Change | 40.2% | -44.1% | 43.1% | 74.0% | 18.5% |
| Total Assets | 55,154 | 51,040 | 49,014 | 41,240 | 35,594 |
| Year-on-Year Change | 8.1% | 4.1% | 18.9% | 15.9% | 8.0% |
| Net Current Assets | 14,727 | 12,836 | 8,858 | 8,124 | 9,847 |
| Year-on-Year Change | 14.7% | 44.9% | 9.0% | -17.5% | 25.8% |
| Total Equity | 26,274 | 21,581 | 18,013 | 9,950 | 6,077 |
| Year-on-Year Change | 21.7% | 19.8% | 81.0% | 63.7% | 23.8% |
| Capital Expenditure | 1,041 | 1,450 | 2,262 | 1,888 | 1,407 |
| Year-on-Year Change | -28.2% | -35.9% | 19.8% | 34.2% | 58.6% |
| Funds from Operations | 12,202 | 11,299 | 9,096 | 10,536 | 5,814 |
| Year-on-Year Change | 8.0% | 24.2% | -13.7% | 81.2% | -20.2% |
| Free Operating Cashflow | 11,161 | 9,849 | 6,834 | 8,648 | 4,407 |
| Year-on-Year Change | 13.3% | 44.1% | -21.0% | 96.2% | -31.1% |
| Total Debt | 14,634 | 15,398 | 15,482 | 15,745 | 15,726 |
| Year-on-Year Change | -5.0% | -0.5 | -1.7% | 0.1% | -1.3% |
| Net Debt | 6,785 | 6,948 | 12,707 | 8,629 | 9,019 |
| Year-on-Year Change | -2.4% | -45.3% | 47.3% | -4.3% | 120.3% |
| Shares Outstanding (Million) | 1,116 | 1,117 | 1,123 | 1,131 | 1,135 |
| Year-on-Year Change | -0.1% | -0.5% | -0.7% | -0.4% | -6.2% |
| Payout Ratio | 35.5% | 45.5% | 25.1% | 33.9% | 54.3% |
| ⇑ – Year-on-Year Increase | Green: ‘Improved’ |
| ⇓ – Year-on-Year Decrease | Red: ‘Worsened’ |
| ⇔ – Year-on-Year Unchanged |
| 2024 | 2023 | 2022 | 2021 | 2020 | |
| CAPITAL STRUCTURE | |||||
| Total Debt/(Total Debt + Equity) | 35.8%⇓ | 41.6%⇓ | 46.2%⇓ | 61.3%⇓ | 72.1%⇓ |
| Net Debt/Equity | 25.8%⇓ | 32.2%⇓ | 70.5%⇓ | 86.7%⇓ | 148.4%⇑ |
| Debt/Total Assets | 26.5%⇓ | 30.2%⇓ | 31.6%⇓ | 38.2%⇓ | 44.2%⇓ |
| Long Term Debt/Net Earnings | 1.3x⇓ | 1.9x⇑ | 1.1x⇓ | 1.5x⇓ | 2.9x⇓ |
| Current Ratio | 2.4x⇑ | 2.3x⇑ | 1.8x⇑ | 1.7x⇓ | 2.1x⇑ |
| Acid Test Ratio | 1.8x⇑ | 1.7x⇑ | 1.2x⇓ | 1.4x⇓ | 1.8x⇑ |
| CASHFLOW RATIOS | |||||
| Funds from Operations/Total Debt | 0.8x⇑ | 0.7x⇑ | 0.6x⇓ | 0.7x⇑ | 0.4x⇓ |
| Funds from Operations/Net Debt | 1.8x⇑ | 1.6x⇑ | 0.7x⇓ | 1.2x⇑ | 0.6x⇓ |
| EBITDA/Interest | 16.9x⇑ | 13.8x⇓ | 36.0x⇑ | 20.3x⇑ | 12.7x⇓ |
| EBIT/Interest | 14.5x⇑ | 11.2x⇓ | 32.4x⇑ | 17.5x⇑ | 10.4x⇓ |
| Net Debt/EBITDA | 0.6x⇓ | 0.7x⇔ | 0.7x⇓ | 0.8x⇓ | 1.2x⇑ |
| Free Operating Cashflow/Interest | 16.0x⇑ | 14.2x⇑ | 14.0x⇓ | 15.5x⇑ | 7.3x⇓ |
| Free Operating Cashflow/Net Debt | 1.6x⇑ | 1.4x⇑ | 0.5x⇓ | 1.0x⇑ | 0.5x⇓ |
| Free Operating Cashflow/Sales | 0.3x⇔ | 0.3x⇑ | 0.2x⇓ | 0.3x⇑ | 0.2x⇓ |
| PROFITABILITY RATIOS | |||||
| Gross Profit Margin | 56.2%⇑ | 55.7%⇓ | 57.8%⇑ | 57.5%⇓ | 60.7%⇓ |
| EBITDA Margin | 30.2%⇑ | 26.8%⇓ | 39.9%⇑ | 33.9%⇑ | 32.5%⇓ |
| EBIT Margin | 25.9%⇑ | 21.7%⇓ | 35.9%⇑ | 29.2%⇑ | 26.6%⇓ |
| PBT Margin | 26.5%⇑ | 20.8%⇓ | 33.9%⇑ | 30.6%⇑ | 24.3%⇓ |
| PAT Margin | 26.0%⇑ | 20.2%⇓ | 29.3%⇑ | 26.9%⇑ | 22.1%⇑ |
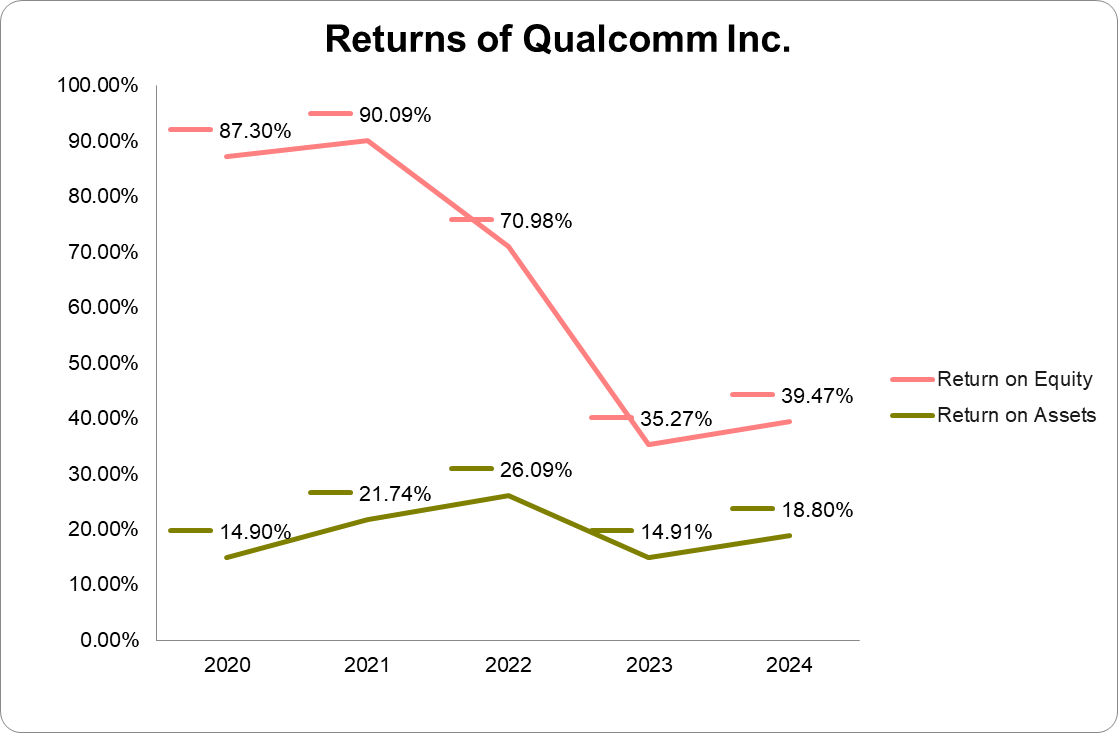
| ROAE | 43.3%⇑ | 38.5%⇓ | 91.5%⇓ | 111.9%⇑ | 96.6%⇓ |
| ROAA | 19.5%⇑ | 15.2%⇓ | 28.3%⇑ | 23.3%⇑ | 15.5%⇓ |