| (US$ in Million) | 2024 | 2023 | 2022 | 2021 | 2020 |
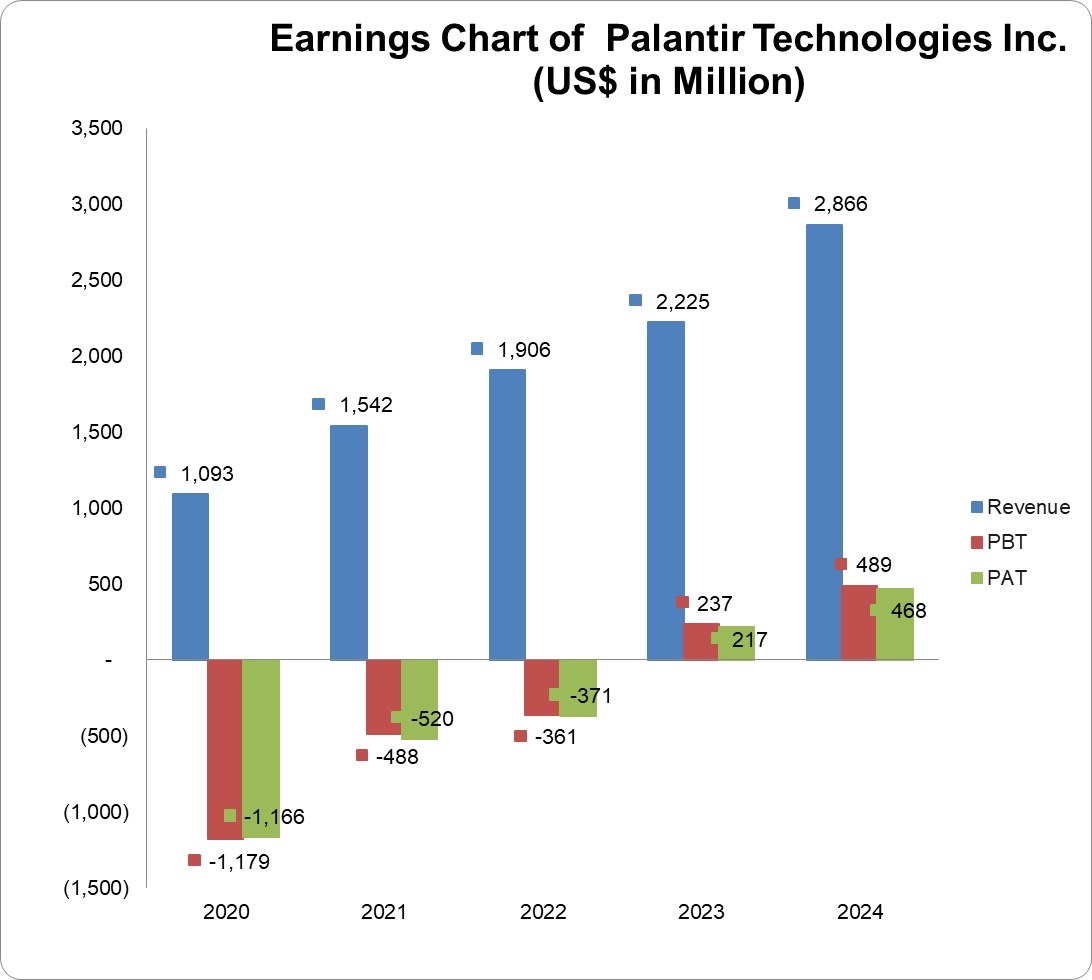
| Turnover | 2,866 | 2,225 | 1,906 | 1,542 | 1,093 |
| Year-on-Year Change | 28.8% | 16.7% | 23.6% | 41.1% | 47.1% |
| Operating Profit | 310 | 120 | -161 | -411 | -1,174 |
| Year-on-Year Change | 158.3% | -174.5% | -60.8% | -65.0% | 103.8% |
| EBITDA | 342 | 153 | -138 | -396 | -1,160 |
| Year-on-Year Change | 123.5% | -210.9% | -65.2% | -65.9% | 105.7% |
| PBT | 489 | 237 | -361 | -488 | -1,179 |
| Year-on-Year Change | 106.3% | -165.7% | -26.0% | -58.6% | 107.9% |
| PAT | 468 | 217 | -371 | -520 | -1,166 |
| Year-on-Year Change | 115.7% | -158.5% | -28.7% | -55.4% | 101.0% |
| Total Assets | 6,341 | 4,522 | 3,461 | 3,247 | 2,691 |
| Year-on-Year Change | 40.2% | 30.7% | 6.6% | 20.7% | 68.8% |
| Net Current Assets | 4,938 | 3,393 | 2,454 | 2,203 | 1,653 |
| Year-on-Year Change | 45.5% | 38.3% | 11.4% | 33.3% | 240.8% |
| Total Equity | 5,094 | 3,561 | 2,642 | 2,291 | 1,523 |
| Year-on-Year Change | 43.1% | 34.8% | 15.3% | 50.4% | -176.9% |
| Capital Expenditure | 13 | 15 | 40 | 13 | 12 |
| Year-on-Year Change | -13.3% | -62.5% | 207.7% | 8.3% | -7.7% |
| Funds from Operations | 1,154 | 712 | 224 | 334 | -297 |
| Year-on-Year Change | 62.1% | 217.9% | -32.9% | -212.5% | 80.0% |
| Free Operating Cashflow | 1,141 | 697 | 184 | 321 | -309 |
| Year-on-Year Change | 63.7% | 278.8% | -42.7% | -203.9% | 73.6% |
| Total Debt | 239 | 229 | 249 | 269 | 457 |
| Year-on-Year Change | 4.4% | -8.0% | -7.4% | -41.1% | 15.4% |
| Net Debt | -1,860 | -602 | -2,350 | -2,022 | -1,554 |
| Year-on-Year Change | 209.0% | -74.4% | 16.2% | 30.1% | 127.5% |
| Shares Outstanding (Million) | 2,250 | 2,147 | 2,064 | 1,924 | 978 |
| Year-on-Year Change | 4.8% | 4.0% | 7.3% | 96.7% | 69.5% |
| Payout Ratio | 0.0% | 0.0% | 0.0% | 0.0% | 0.0% |
| ⇑ – Year-on-Year Increase | Green: ‘Improved’ |
| ⇓ – Year-on-Year Decrease | Red: ‘Worsened’ |
| ⇔ – Year-on-Year Unchanged |
| 2024 | 2023 | 2022 | 2021 | 2020 | |
| CAPITAL STRUCTURE | |||||
| Total Debt/(Total Debt + Equity) | 4.5%⇓ | 6.0%⇓ | 8.6%⇓ | 10.5%⇓ | 23.1%⇑ |
| Net Debt/Equity | -36.5%⇓ | -16.9%⇑ | -89.0%⇓ | -88.3%⇑ | -102.0%⇓ |
| Debt/Total Assets | 3.8%⇓ | 5.1%⇓ | 7.2%⇓ | 8.3%⇓ | 17.0%⇓ |
| Long Term Debt/Net Earnings | 0.4x⇓ | 0.8x⇑ | -0.6x⇓ | -0.4x⇔ | -0.4x⇑ |
| Current Ratio | 6.0x⇑ | 5.6x⇑ | 5.2x⇑ | 4.3x⇑ | 3.7x⇑ |
| Acid Test Ratio | 6.0x⇑ | 5.6x⇑ | 5.2x⇑ | 4.3x⇑ | 3.7x⇑ |
| CASHFLOW RATIOS | |||||
| Funds from Operations/Total Debt | 4.8x⇑ | 3.1x⇑ | 0.9x⇓ | 1.2x⇑ | -0.7x⇓ |
| Funds from Operations/Net Debt | -0.6x⇑ | -1.2x⇓ | -0.1x⇑ | -0.2x⇓ | 0.2x⇔ |
| EBITDA/Interest | N/A | N/A | -34.5x⇑ | -99.0x⇓ | -82.9x⇑ |
| EBIT/Interest | N/A | N/A | -40.3x⇑ | -102.8x⇓ | -83.9x⇑ |
| Net Debt/EBITDA | -5.4x⇓ | -3.9x⇓ | 17.0x⇑ | 5.1x⇑ | 1.3x⇑ |
| Free Operating Cashflow/Interest | N/A | N/A | 46.0x⇓ | 80.3x⇑ | -22.1x⇑ |
| Free Operating Cashflow/Net Debt | -0.6x⇑ | -1.2x⇓ | -0.1x⇑ | -0.2x⇓ | 0.2x⇓ |
| Free Operating Cashflow/Sales | 0.4x⇑ | 0.3x⇑ | 0.1x⇓ | 0.2x⇑ | -0.3x⇓ |
| PROFITABILITY RATIOS | |||||
| Gross Profit Margin | 80.3%⇓ | 80.6%⇑ | 78.5%⇑ | 78.0%⇑ | 67.7%⇑ |
| EBITDA Margin | 11.9%⇑ | 6.9%⇑ | -7.2%⇑ | -25.7%⇑ | -106.1%⇓ |
| EBIT Margin | 10.8%⇑ | 5.4%⇑ | -8.5%⇑ | -26.7%⇑ | -107.4%⇓ |
| PBT Margin | 17.1%⇑ | 10.7%⇑ | -18.9%⇑ | -31.7%⇑ | -107.9%⇓ |
| PAT Margin | 16.3%⇑ | 9.8%⇑ | -19.5%⇑ | -33.7%⇑ | -106.7%⇓ |
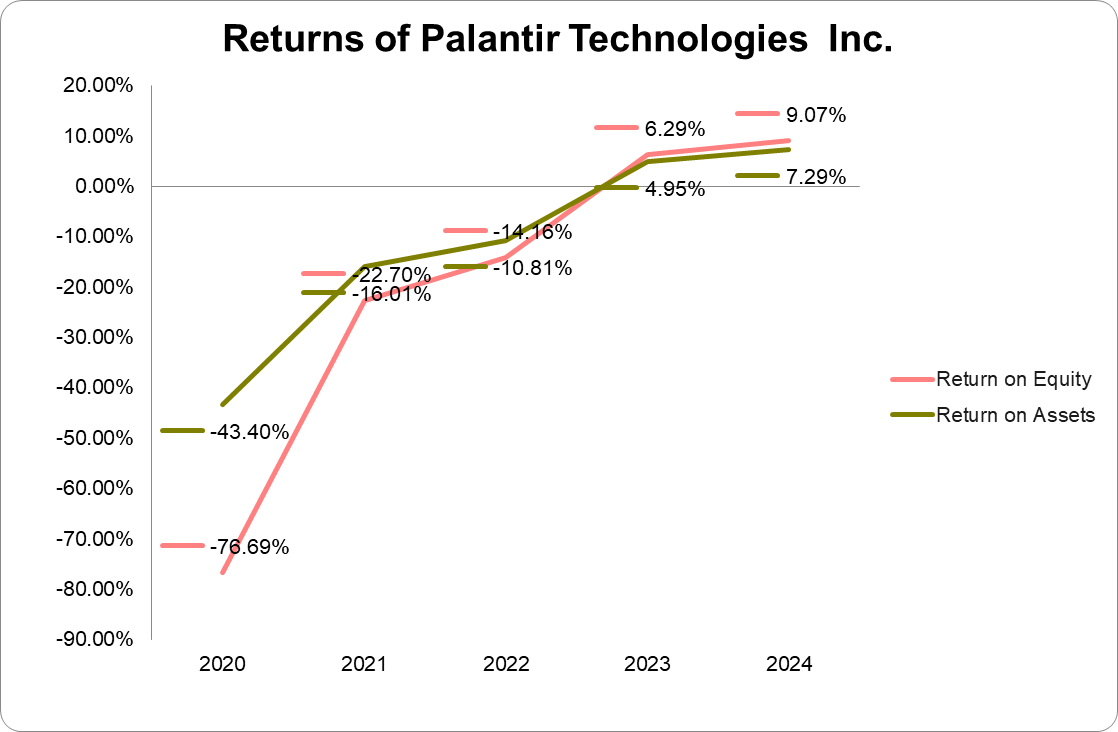
| ROAE | 10.7%⇑ | 7.2%⇑ | -15.2%⇑ | -27.3%⇓ | 510.0%⇑ |
| ROAA | 8.5%⇑ | 5.6%⇑ | -11.2%⇑ | -17.5%⇑ | -54.5%⇑ |