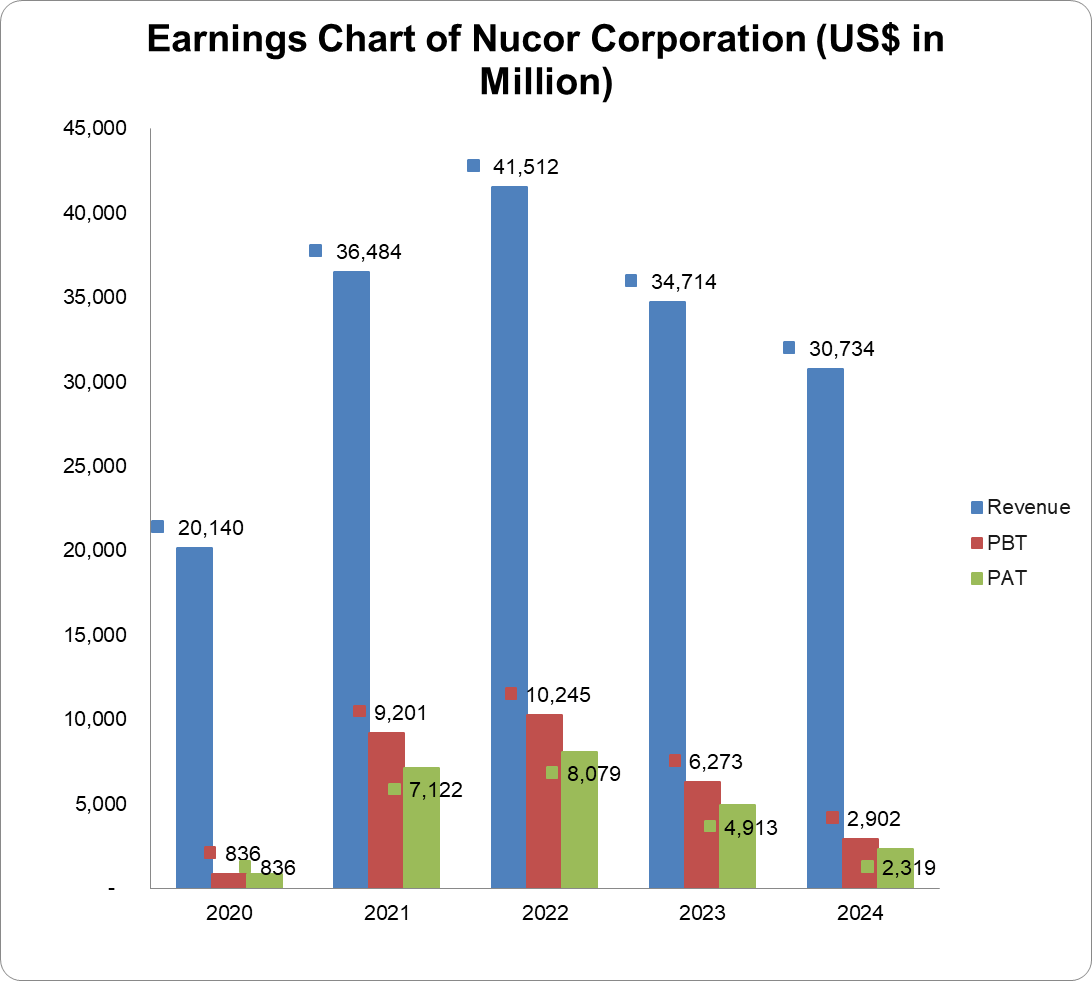
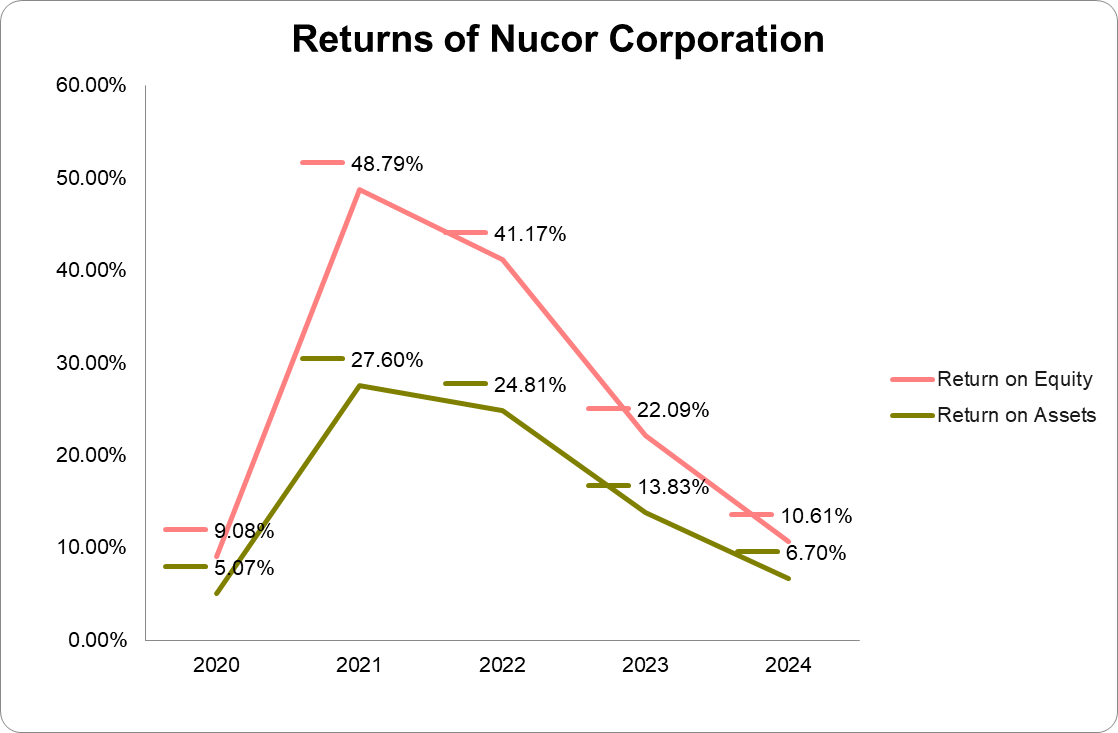
| (US$ in Million) | 2024 | 2023 | 2022 | 2021 | 2020 |
| Turnover | 30,734 | 34,714 | 41,512 | 36,484 | 20,140 |
| Year-on-Year Change | -11.5% | -16.4% | 13.8% | 81.2% | -10.8% |
| Operating Profit | 2,872 | 6,243 | 10,415 | 9,360 | 989 |
| Year-on-Year Change | -54.0% | -40.1% | 11.3% | 846.4% | -48.1% |
| EBITDA | 4,228 | 7,412 | 11,477 | 10,225 | 1,774 |
| Year-on-Year Change | -43.0% | -35.4% | 12.2% | 476.4% | -32.8% |
| PBT | 2,902 | 6,273 | 10,245 | 9,201 | 836 |
| Year-on-Year Change | -53.7% | -38.8% | 11.4% | 1,000.6% | -53.1% |
| PAT | 2,319 | 4,913 | 8,079 | 7,122 | 836 |
| Year-on-Year Change | -52.8% | -39.2% | 13.4% | 751.9% | -39.0% |
| Total Assets | 33,940 | 35,340 | 32,479 | 25,823 | 20,125 |
| Year-on-Year Change | -4.0% | 8.8% | 25.8% | 28.3% | 9.7% |
| Net Current Assets | 7,498 | 11,791 | 10,362 | 7,643 | 6,861 |
| Year-on-Year Change | -36.4% | 13.8% | 35.6% | 11.4% | 19.1% |
| Total Equity | 21,417 | 22,123 | 19,570 | 14,604 | 11,232 |
| Year-on-Year Change | -3.2% | 13.1% | 34.0% | 30.0% | 4.1% |
| Capital Expenditure | 3,931 | 2,285 | 5,501 | 3,048 | 1,631 |
| Year-on-Year Change | 72.0% | -58.5% | 80.5% | 86.9% | 4.6% |
| Funds from Operations | 3,979 | 7,112 | 10,072 | 6,231 | 2,697 |
| Year-on-Year Change | -44.1% | -29.4% | 61.6% | 131.0% | -4.0% |
| Free Operating Cashflow | 48 | 4,827 | 4,571 | 3,183 | 1,066 |
| Year-on-Year Change | -99.0% | 5.6% | 43.6% | 198.6% | -14.7% |
| Total Debt | 6,950 | 6,842 | 6,692 | 5,684 | 5,341 |
| Year-on-Year Change | 1.6% | 2.2% | 17.7% | 6.4% | 21.9% |
| Net Debt | 3,392 | 459 | 2,411 | 3,319 | 2,701 |
| Year-on-Year Change | 639.0% | -81.0% | -27.4% | 22.9% | -5.2% |
| Shares Outstanding (Million) | 238 | 250 | 262 | 292 | 303 |
| Year-on-Year Change | -4.8% | -4.6% | -10.3% | -3.6% | -0.7% |
| Payout Ratio | 22.6% | 10.4% | 6.5% | 6.6% | 47.8% |
| ⇑ – Year-on-Year Increase | Green: ‘Improved’ |
| ⇓ – Year-on-Year Decrease | Red: ‘Worsened’ |
| ⇔ – Year-on-Year Unchanged |
| 2024 | 2023 | 2022 | 2021 | 2020 | |
| CAPITAL STRUCTURE | |||||
| Total Debt/(Total Debt + Equity) | 24.5%⇑ | 23.6%⇓ | 25.5%⇓ | 28.0%⇓ | 32.2%⇑ |
| Net Debt/Equity | 15.8%⇑ | 2.1%⇓ | 12.3%⇓ | 22.7%⇓ | 24.1%⇓ |
| Debt/Total Assets | 20.5%⇑ | 19.4%⇓ | 20.6%⇓ | 22.0%⇓ | 26.5%⇑ |
| Long Term Debt/Net Earnings | 2.9x⇑ | 1.5x⇑ | 0.9x⇑ | 0.7x⇓ | 5.8x⇑ |
| Current Ratio | 2.5x⇓ | 3.6x⇑ | 3.4x⇑ | 2.5x⇓ | 3.6x⇑ |
| Acid Test Ratio | 1.5x⇓ | 2.4x⇑ | 2.1x⇑ | 1.3x⇓ | 2.3x⇑ |
| CASHFLOW RATIOS | |||||
| Funds from Operations/Total Debt | 0.6x⇓ | 1.0x⇓ | 1.5x⇑ | 1.1x⇑ | 0.5x⇓ |
| Funds from Operations/Net Debt | 1.2x⇓ | 15.5x⇑ | 4.2x⇑ | 1.9x⇑ | 1.0x⇔ |
| EBITDA/Interest | 18.5x⇓ | 30.1x⇓ | 52.4x⇓ | 62.7x⇑ | 10.6x⇓ |
| EBIT/Interest | 12.6x⇓ | 25.4x⇓ | 47.6x⇓ | 57.4x⇑ | 5.9x⇓ |
| Net Debt/EBITDA | 0.8x⇑ | 0.1x⇓ | 0.2x⇓ | 0.3x⇓ | 1.5x⇑ |
| Free Operating Cashflow/Interest | 0.2x⇓ | 19.6x⇓ | 20.9x⇑ | 19.5x⇑ | 6.4x⇓ |
| Free Operating Cashflow/Net Debt | 0.0x⇓ | 10.5x⇑ | 1.9x⇑ | 1.0x⇑ | 0.4x⇔ |
| Free Operating Cashflow/Sales | 0.0x⇓ | 0.1x⇔ | 0.1x⇔ | 0.1x⇔ | 0.1x⇔ |
| PROFITABILITY RATIOS | |||||
| Gross Profit Margin | 13.4%⇓ | 22.5%⇓ | 30.1%⇓ | 30.2%⇑ | 11.1%⇓ |
| EBITDA Margin | 13.8%⇓ | 21.4%⇓ | 27.7%⇓ | 28.0%⇑ | 8.8%⇓ |
| EBIT Margin | 9.3%⇓ | 18.0%⇓ | 25.1%⇓ | 25.7%⇑ | 4.9%⇓ |
| PBT Margin | 9.4%⇓ | 18.1%⇓ | 24.7%⇓ | 25.2%⇑ | 4.2%⇓ |
| PAT Margin | 7.6%⇓ | 14.2%⇓ | 19.5%⇔ | 19.5%⇑ | 4.2%⇓ |
| ROAE | 10.4%⇓ | 23.5%⇓ | 47.2%⇓ | 55.2%⇑ | 9.3%⇓ |
| ROAA | 6.6%⇓ | 14.4%⇓ | 27.6%⇓ | 31.0%⇑ | 5.3%⇓ |