| ($ in Million) | 2025 | 2024 | 2023 | 2022 | 2021 |
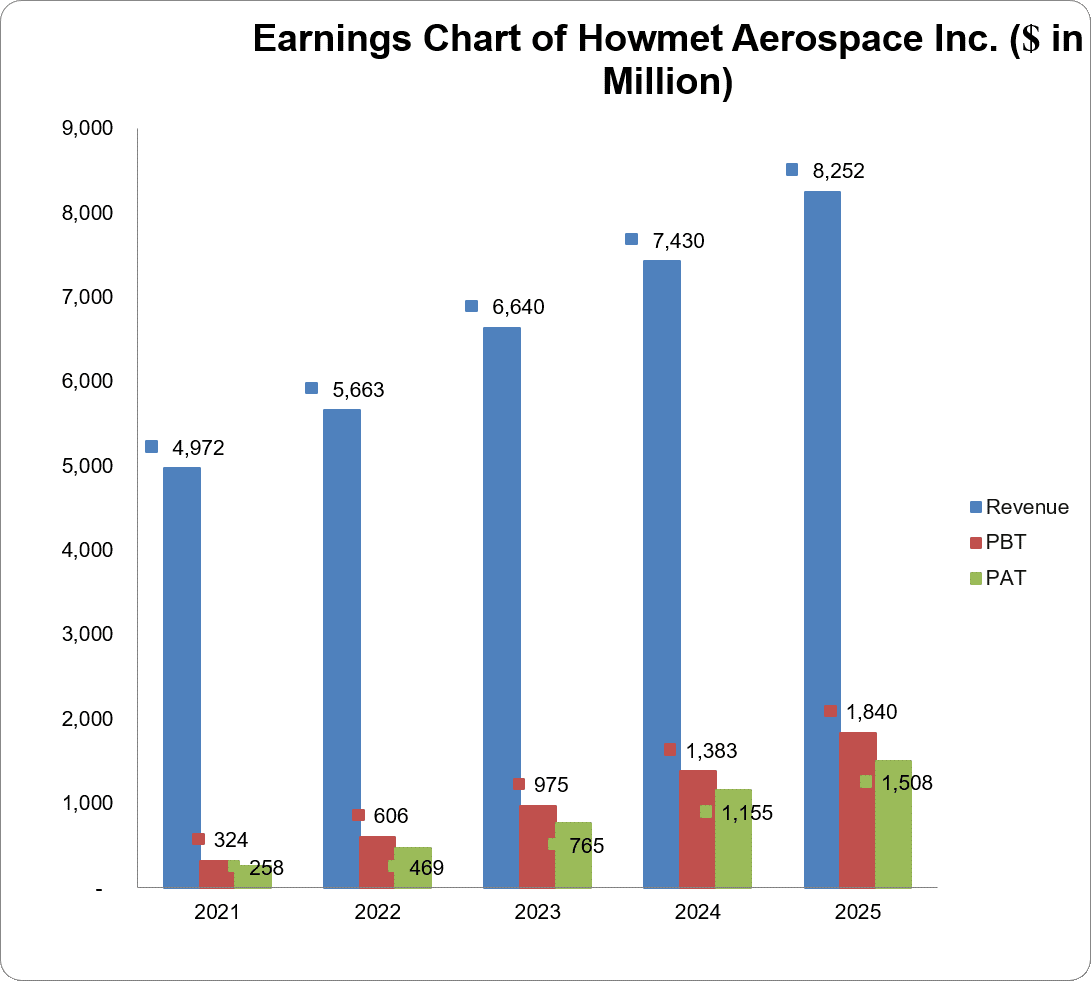
| Turnover | 8,252 | 7,430 | 6,640 | 5,663 | 4,972 |
| Year-on-Year Change | 11.1% | 11.9% | 17.3% | 13.9% | -5.5% |
| Operating Profit | 2,046 | 1,633 | 1,203 | 919 | 748 |
| Year-on-Year Change | 25.3% | 35.7% | 30.9% | 22.9% | 19.5% |
| EBITDA | 2,329 | 1,910 | 1,475 | 1,184 | 1,018 |
| Year-on-Year Change | 21.9% | 29.5% | 24.6% | 16.3% | 5.6% |
| PBT | 1,840 | 1,383 | 975 | 606 | 324 |
| Year-on-Year Change | 33.0% | 41.9% | 60.9% | 87.0% | 89.5% |
| PAT | 1,508 | 1,155 | 765 | 469 | 258 |
| Year-on-Year Change | 30.6% | 51.0% | 63.1% | 81.8% | -1.2% |
| Total Assets | 11,179 | 10,519 | 10,428 | 10,255 | 10,219 |
| Year-on-Year Change | 6.3% | 0.9% | 1.7% | 0.4% | -10.7% |
| Net Current Assets | 2,008 | 1,813 | 1,532 | 1,661 | 1,484 |
| Year-on-Year Change | 10.8% | 18.3% | -7.8% | 11.9% | -26.2% |
| Total Equity | 5,353 | 4,554 | 4,037 | 3,601 | 3,508 |
| Year-on-Year Change | 17.6% | 12.8% | 12.1% | 2.7% | -1.9% |
| Capital Expenditure | 453 | 321 | 219 | 193 | 199 |
| Year-on-Year Change | 41.1% | 46.6% | 13.5% | -3.0% | -25.5% |
| Funds from Operations | 1,884 | 1,298 | 901 | 733 | 449 |
| Year-on-Year Change | 45.2% | 44.1% | 22.9% | 63.3% | 4,888.9% |
| Free Operating Cashflow | 1,431 | 977 | 682 | 540 | 250 |
| Year-on-Year Change | 46.5% | 43.3% | 26.3% | 116.0% | -196.9% |
| Total Debt | 3,050 | 3,315 | 3,706 | 4,162 | 4,232 |
| Year-on-Year Change | -8.0% | -10.6% | -11.0% | -1.7% | -16.6% |
| Net Debt | 2,308 | 2,751 | 3,096 | 3,371 | 3,512 |
| Year-on-Year Change | -16.1% | -11.1% | -8.2% | -4.0% | 1.4% |
| Shares Outstanding-ordinary shares (Million) | 404.0 | 408.0 | 412.0 | 416.0 | 430.0 |
| Year-on-Year Change | -1.0% | -1.0% | -1.0% | -3.3% | -1.2% |
| Payout Ratio | 11.8% | 9.2% | 9.2% | 8.9% | 6.7% |
| ⇑ – Year-on-Year Increase | Green: ‘Improved’ |
| ⇓ – Year-on-Year Decrease | Red: ‘Worsened’ |
| ⇔ – Year-on-Year Unchanged |
| 2025 | 2024 | 2023 | 2022 | 2021 | |
| CAPITAL STRUCTURE | |||||
| Total Debt/(Total Debt + Equity) | 36.3%⇓ | 42.1%⇓ | 47.9%⇓ | 53.6%⇓ | 54.7%⇓ |
| Net Debt/Equity | 43.1%⇓ | 60.4%⇓ | 76.7%⇓ | 93.6%⇓ | 100.1%⇑ |
| Debt/Total Assets | 27.3%⇓ | 31.5%⇓ | 35.5%⇓ | 40.6%⇓ | 41.4%⇓ |
| Long Term Debt/Net Earnings | 1.7x⇓ | 3.0x⇓ | 4.5x⇓ | 8.5x⇓ | 12.5x⇓ |
| Current Ratio | 2.1x⇓ | 2.2x⇑ | 1.9x⇓ | 2.1x⇓ | 2.2x⇓ |
| Acid Test Ratio | 1.1x⇑ | 1.0x⇑ | 0.9x⇓ | 1.0x⇓ | 1.1x⇓ |
| CASHFLOW RATIOS | |||||
| Funds from Operations/Total Debt | 0.6x⇑ | 0.4x⇑ | 0.2x⇔ | 0.2x⇑ | 0.1x⇑ |
| Funds from Operations/Net Debt | 0.8x⇑ | 0.5x⇑ | 0.3x⇑ | 0.2x⇑ | 0.1x⇑ |
| EBITDA/Interest | 13.2x⇑ | 9.8x⇑ | 6.5x⇑ | 5.0x⇑ | 2.5x⇔ |
| EBIT/Interest | 11.6x⇑ | 8.4x⇑ | 5.3x⇑ | 3.9x⇑ | 1.8x⇑ |
| Net Debt/EBITDA | 1.0x⇓ | 1.4x⇓ | 2.1x⇓ | 2.9x⇓ | 3.5x⇓ |
| Free Operating Cashflow/Interest | 8.1x⇑ | 5.0x⇑ | 3.0x⇑ | 2.3x⇑ | 0.6x⇑ |
| Free Operating Cashflow/Net Debt | 0.6x⇑ | 0.4x⇑ | 0.2x⇔ | 0.2x⇑ | 0.1x⇑ |
| Free Operating Cashflow/Sales | 0.2x⇑ | 0.1x⇔ | 0.1x⇔ | 0.1x⇔ | 0.1x⇑ |
| PROFITABILITY RATIOS | |||||
| Gross Profit Margin | 34.2%⇑ | 31.1%⇑ | 28.1%⇑ | 27.6%⇓ | 27.7%⇑ |
| EBITDA Margin | 28.2%⇑ | 25.7%⇑ | 22.2%⇑ | 20.9%⇑ | 20.5%⇑ |
| EBIT Margin | 24.8%⇑ | 22.0%⇑ | 18.1%⇑ | 16.2%⇑ | 15.0%⇑ |
| PBT Margin | 22.3%⇑ | 18.6%⇑ | 14.7%⇑ | 10.7%⇑ | 6.5%⇑ |
| PAT Margin | 18.3%⇑ | 15.6%⇑ | 11.5%⇑ | 8.3%⇑ | 5.2%⇑ |
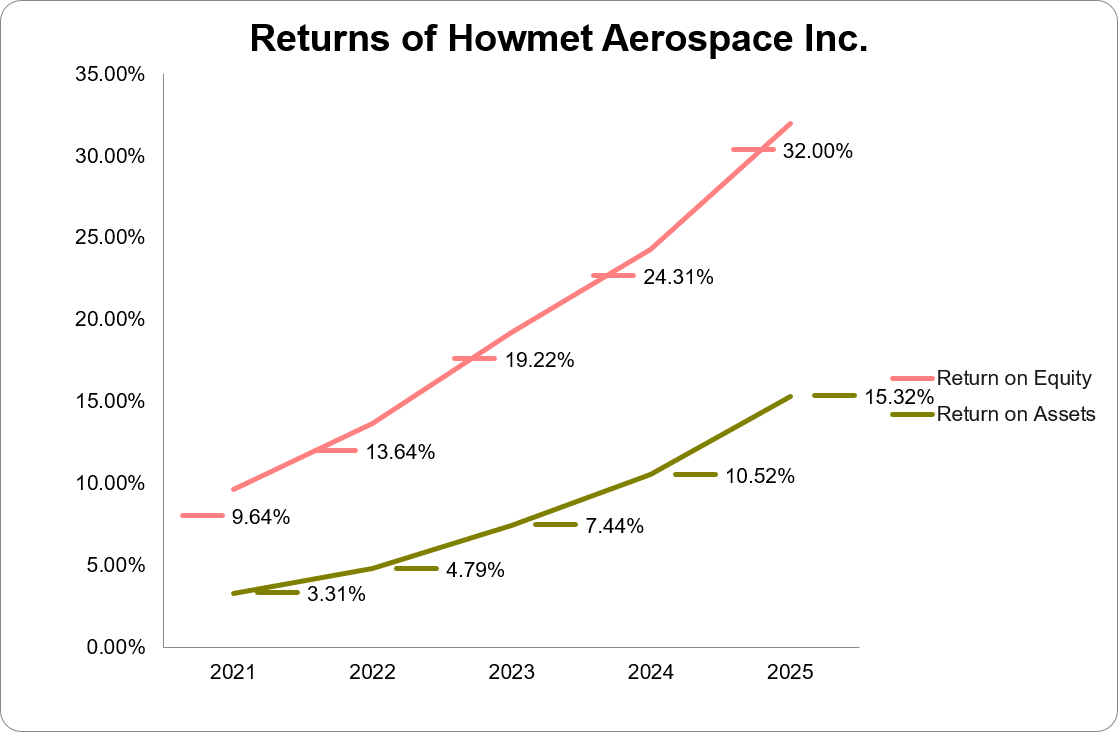
| ROAE | 34.6%⇑ | 25.8%⇑ | 20.3%⇑ | 13.8%⇑ | 9.5%⇓ |
| ROAA | 15.8%⇑ | 10.6%⇑ | 7.5%⇑ | 4.8%⇑ | 3.1%⇓ |