| Ticker: GEREGU | Nature of Business: Electric Power Generation | Location: Nigeria |
| Recent Price: NGN825.70 | 52-Week High/Low: NGN1,141.50/743.20 | Estimated Fair Value: NGN276.40- NGN403.78 |
| Expected Return: 45.7% | Consider Buy: Below NGN403.78 | Business Risk: Medium |
| Financial Risk: Medium | Economic Moat: Weak | Corporate Governance: Strong |
Company Overview
Geregu Power Plc (GEREGU) is a Nigerian electric power generation company incorporated in November 2006. It began operations in March 2007. The company’s shares were listed on the Nigerian Stock Exchange on October 5, 2022.
The company owns the gas-powered Geregu Power Plant in Kogi State, Nigeria. The plant comprises three turbines and an installed capacity of about 435MW. Amperion Power Distribution Company Limited (Amperion) initially acquired a 51% equity stake in the company owing to privatisation by the Federal Government of Nigeria in 2013. Amperion increased its shareholding to 100% following the divestment of the government in 2021. Presently, Amperion holds a 76.9% equity stake in GEREGU (2024: 78.1%) while Libreville Power Limited’s ownership stake is 5% (2024: 5%).
The company has a newly constituted board of directors following the acquisition of 97% shareholding of Amperion by MA’AM Energy Limited for $750 million in December 2025. Senator Abdul-Aziz Abubakar Yari of MA’AM assumed the chairmanship of the board due to the resignation of Olufemi Otedola on the 29th December 2025. Mohammed Sani Jaoji was named acting chief executive officer in August 2026, replacing Sean Manley. Mr. Manley was appointed an interim chief executive officer of the company after the resignation of Akin Akinfemiwa in December 2025.
Investment Thesis
There is high demand for a stable and reliable power supply in Nigeria. Even though the electric power generation capacity in the country exceeds power distribution multiple times, the total generation capacity is below what is required for both domestic and industrial use. To attract additional investment into the industry, the government has embarked on reforms to address the challenges in the industry, such as inadequate transmission infrastructure and huge receivables. We believe that the huge capital requirement can ward off potential new entrants and give a competitive advantage to energy generation companies like GEREGU.
GEREGU is bedevilled by liquidity pressure due to huge unpaid customer invoices. The payments for power sales are delayed because a number of companies are involved before electricity is distributed to the consumers, namely a transmission company, the Nigerian Bulk Electricity Trading Plc, and distribution companies. Electric power generation companies, connected to the national grid, sell to the Nigerian Bulk Electricity Trading Plc (NBET), which then sells to the distribution companies. The power generation companies are paid from the payments distribution companies make to NBET. This revenue model increases the risk of having bad debts and cash flow problems. In fact, a notable proportion of the trade receivables turn bad. GEREGU’s trade receivables impairment stood at NGN26.3 billion in 2025 (2024: NGN16.2 billion); in other words, trade receivables were 11.6% of gross trade receivables in 2025 (2024: 11.8%). The longer it takes for the company to receive payment for electricity sold, the higher the likelihood that receivables will turn bad. Also, paying suppliers is a herculean task for the company, putting the company under serious liquidity pressure.
GEREGU carries a huge amount of debt on its balance sheet. However, the debt-to-equity ratio has been dropping in the past three years. We expect a stronger financial position going forward because of the government’s efforts to ensure outstanding payments are settled. For example, NBET, which the Federal Government of Nigeria owns, has started issuing bonds to raise finance for settling outstanding balances with power generation companies, easing their liquidity worries.
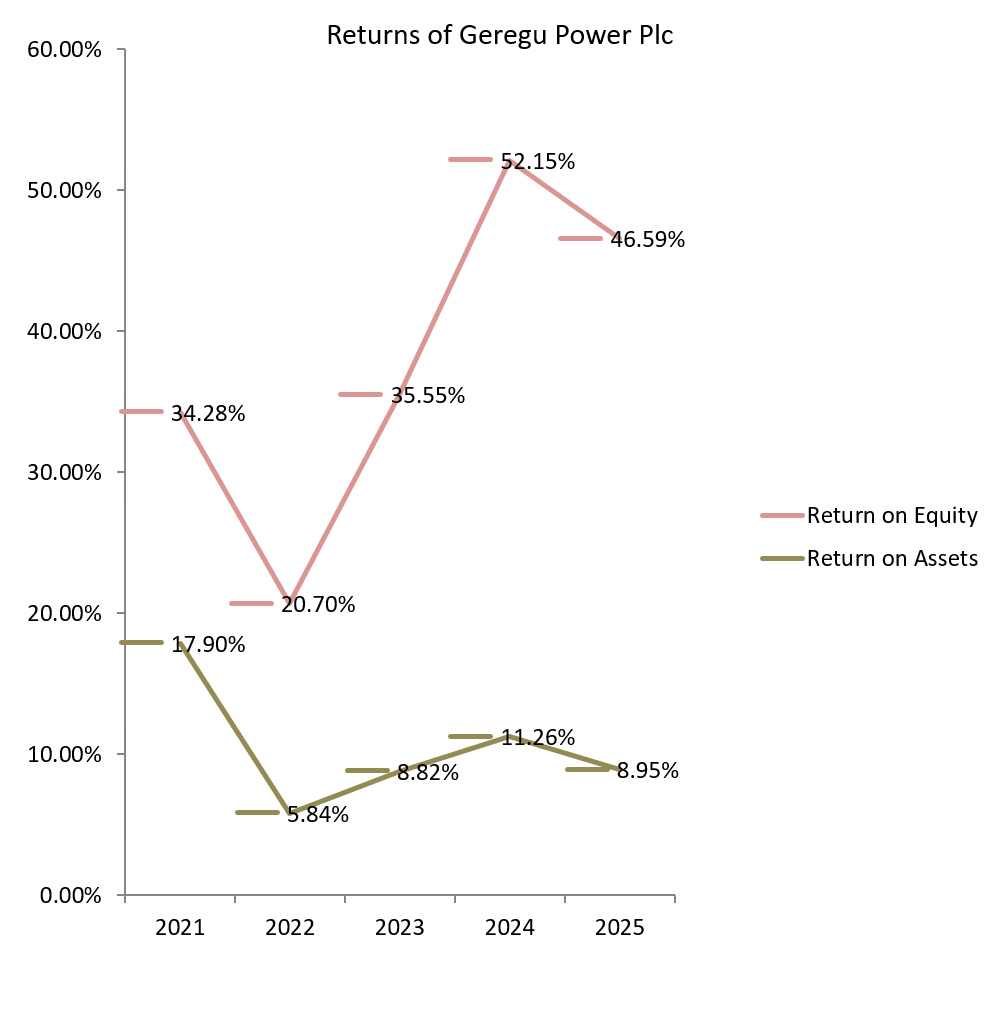
GEREGU has been attractive to investors owing to its earnings growth potential. Its Profit After Tax (PAT) has risen at a Compound Annual Growth Rate (CAGR) of 38.9% over the past three years, while revenue has increased at a 3-Year CAGR of 57.2%. The company’s 6-year average gross profit margin and operating profit margin stood at 45.9% and 33.9% respectively. In 2025, the Return on Average Equity was 49% while the Return on Average Assets was 9.9%. In addition, the company has been paying dividends to the shareholders regularly.
Valuation
Historically, GEREGU’s shares traded at an average of 77.1 times earnings, and 33.3 times book value. In our opinion, the fair value of GEREGU’s share is between NGN276.40 and NGN403.78. Therefore, the shares of GEREGU are overpriced at the current market price of NGN825.70 per share.
Financial Overview
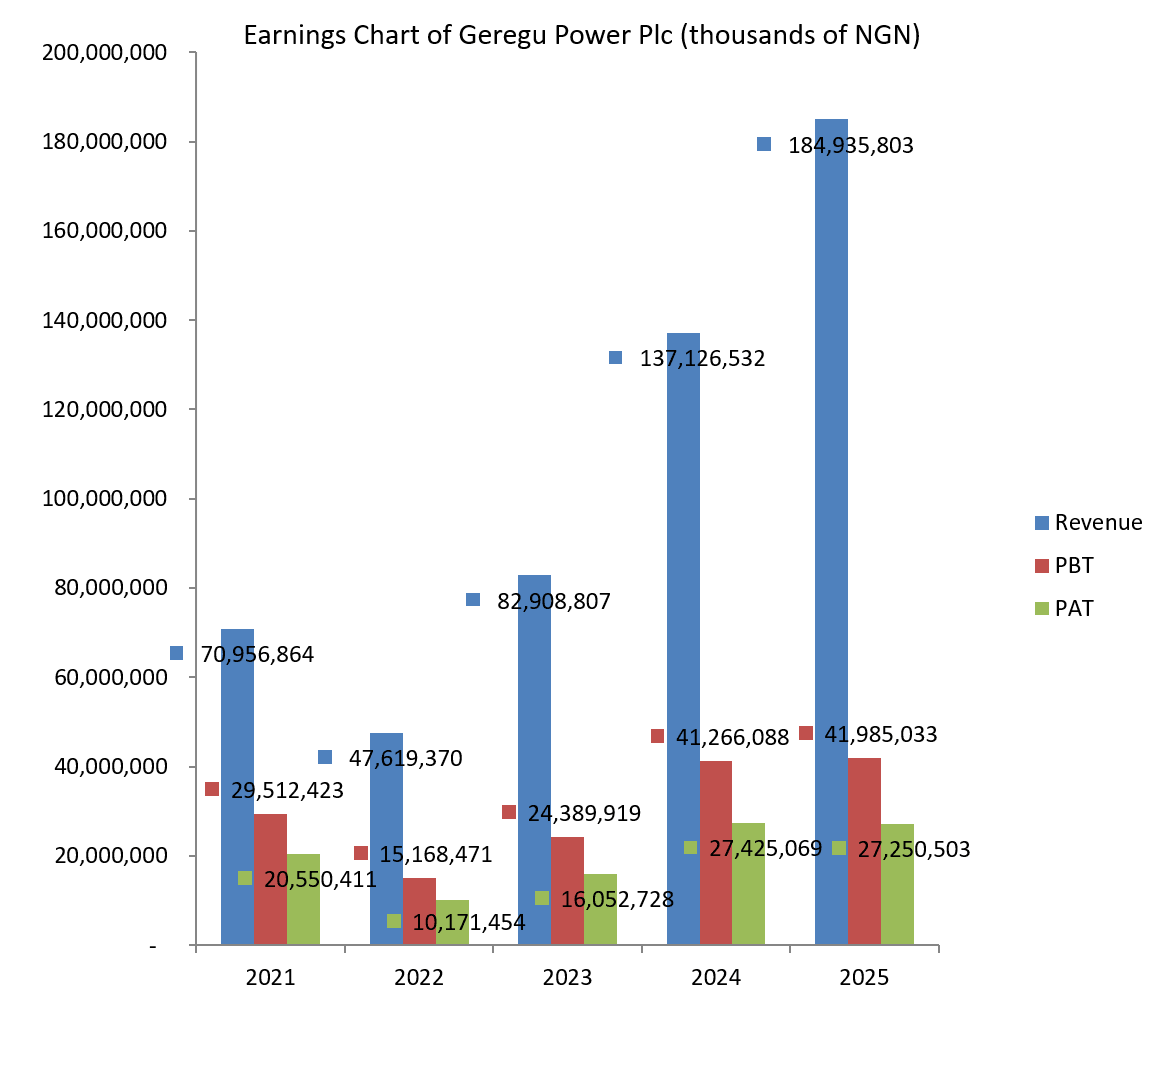
GEREGU posted a revenue of NGN184.9 billion in 2025, up by 34.9% compared to the NGN137.1 billion in the earlier year. The company has been growing its revenue at a compound rate of 28.1% over the past five years. Gross profit gained NGN11.5 billion or 18.3% year-on-year to NGN74.2 billion. However, the gross profit margin dropped 5.6 percentage points because the cost of sales rose faster than revenue. Revenue rose by 34.9% while cost of sales rose by 48.8%. Operating profit jumped by 12.1% to NGN48.1 billion. However, PAT fell by less than 1% to close at NGN27.3 billion in the 2025 fiscal year.
The profit margins of GEREGU declined in the year under consideration owing to a rise in costs. The total cost to turnover ratio increased from 68.3% in 2024 to 74.9% in 2025. The gross profit margin decreased from 45.8% to 40.1%; operating profit margin declined from 31.3% to 26%; likewise, the Profit Before Tax (PBT) margin lost 7.4 percentage points to 22.7%, while PAT (Profit After Tax) margin decreased to 14.7% from 20%.
GEREGU’s total assets have been increasing in the past four years. The company boasts total assets of NGN305 billion at the end of the 2025 fiscal year. The major driver of rising total assets has been trade and other receivables, which stood at NGN201.1 billion at the 2025 year-end. While total assets swelled by 25.3% year-on-year, trade and other receivables expanded by 65.1%. In addition, trade and other receivables accounted for 65.9% of total assets (2024:50%). This means that it carried a huge amount of trade receivables due to credit sales. The company generates free cash flow for shareholders in spite of the regular spending on capital. The only exception in the last six years was 2024 when it recorded a negative free cash flow of NGN14.8 billion owing to a massive capital expenditure of NGN41.3 billion. The free cash flow in 2025 was NGN18.2 billion (2023: NGN54.6 billion). The total debt of GEREGU rose from NGN65.8 billion in 2024 to NGN68.1 billion in 2025, amounting to a year-on-year growth of 3.4%. Total debt has been exceeding total equity, suggesting it has been highly financed with debt. In 2025, the total debt-to-total equity ratio was 116.1% (2024:125.2%). However, it accounted for only 22.3% of total assets in 2025 (2024:27%). In our opinion, the company’s long-term viability has not been impaired.
Business Risk
Gas supply shortage or disruption can cripple the operations of GEREGU and result in a significant decline in revenue. In addition, the business is capital intensive, requiring the company to import machinery and equipment; consequently, exchange rate volatility can reduce the company’s profit. GEREGU’s earnings can also be threatened by regulatory requirements.
Recommendation: Overpriced
| (NGN in Millions) | 2025 | 2024 | 2023 | 2022 | 2021 |
| Turnover | 184,936 | 137,127 | 82,909 | 47,619 | 70,957 |
| Year-on-Year Change | 34.9% | 65.4% | 74.1% | -32.9% | 32.2% |
| Operating Profit | 48,149 | 42,953 | 31,140 | 14,820 | 29,523 |
| Year-on-Year Change | 12.1% | 37.9% | 110.1% | -49.8% | 54.5% |
| EBITDA | 56,863 | 47,921 | 33,723 | 17,383 | 34,141 |
| Year-on-Year Change | 22.8% | 42.1% | 94.0% | -49.1% | 46.0% |
| PBT | 41,985 | 41,266 | 24,390 | 15,168 | 29,512 |
| Year-on-Year Change | 1.7% | 69.2% | 60.8% | -48.6% | 42.9% |
| PAT | 27,251 | 27,425 | 16,053 | 10,171 | 20,550 |
| Year-on-Year Change | -0.6% | 70.8% | 57.8% | -50.5% | 45.5% |
| Total Assets | 305,005 | 243,470 | 182,043 | 174,030 | 114,821 |
| Year-on-Year Change | 25.3% | 33.7% | 4.6% | 51.6% | -6.7% |
| Net Current Assets | 27,740 | 27,426 | 74,752 | 87,582 | 35,964 |
| Year-on-Year Change | 1.1% | -63.3% | -14.7% | 143.5% | -8.2% |
| Total Equity | 58,628 | 52,565 | 45,154 | 49,103 | 59,939 |
| Year-on-Year Change | 11.5% | 16.4% | -8.0% | -18.1% | -22.1% |
| Capital Expenditure | 1,409 | 41,276 | 934 | 588 | 599 |
| Year-on-Year Change | -96.6% | 4,321.7% | 58.7% | -1.9% | 245.3% |
| Funds from Operations | 19,603 | 26,511 | 55,565 | 8,423 | 32,908 |
| Year-on-Year Change | -26.1%2 | -52.3% | 559.7% | -74.4% | 1,023.3% |
| Free Operating Cashflow | 18,194 | -14,766 | 54,632 | 7,835 | 32,309 |
| Year-on-Year Change | -223.2% | -127.0% | 597.3% | -75.8% | 1,072.2% |
| Total Debt | 68,087 | 65,820 | 63,634 | 75,565 | 9,281 |
| Year-on-Year Change | 3.4% | 3.4% | -15.8% | 714.2% | N/A |
| Net Debt | 36,240 | 25,885 | 63,634 | 75,565 | 9,281 |
| Year-on-Year Change | 40.0% | -59.3% | -15.8% | 714.2% | N/A |
| Shares Outstanding-ordinary shares (Million) | 2,500 | 2,500 | 2,500 | 2,500 | 10 |
| Year-on-Year Change | 0.0% | 0.0% | 0.0% | 24,900.0% | 0.0% |
| Payout Ratio | 82.6% | 77.5% | 124.6% | 196.6% | N/A |
| ⇑ – Year-on-Year Increase | Green: ‘Improved’ |
| ⇓ – Year-on-Year Decrease | Red: ‘Worsened’ |
| ⇔ – Year-on-Year Unchanged |
| 2025 | 2024 | 2023 | 2022 | 2021 | |
| CAPITAL STRUCTURE | |||||
| Total Debt/(Total Debt + Equity) | 53.7%⇓ | 55.6%⇓ | 58.5%⇓ | 60.6%⇑ | 13.4%⇑ |
| Net Debt/Equity | 61.8%⇑ | 49.2%⇓ | 140.9%⇓ | 153.9%⇑ | 15.5%⇑ |
| Debt/Total Assets | 22.3%⇓ | 27.0%⇓ | 35.0%⇓ | 43.4%⇑ | 8.1%⇑ |
| Long Term Debt/Net Earnings | 1.0x⇓ | 1.5x⇓ | 3.6x⇓ | 6.7x⇑ | 0.3x⇑ |
| Current Ratio | 1.1x⇓ | 1.2x⇓ | 2.1x⇓ | 2.8x⇑ | 1.9x⇓ |
| Acid Test Ratio | 1.1x⇓ | 1.2x⇓ | 2.0x⇓ | 2.8x⇑ | 1.9x⇓ |
| CASHFLOW RATIOS | |||||
| Funds from Operations/Total Debt | 0.3x⇓ | 0.4x⇓ | 0.9x⇑ | 0.1x⇓ | 3.6x⇑ |
| Funds from Operations/Net Debt | 0.5x⇓ | 1.0x⇑ | 0.9x⇑ | 0.1x⇓ | 3.6x⇑ |
| EBITDA/Interest | 4.7x⇔ | 4.7x⇑ | 2.3x⇓ | 2.4x⇓ | 35.6x⇓ |
| EBIT/Interest | 3.8x⇓ | 4.2x⇑ | 2.1x⇑ | 2.0x⇓ | 30.8x⇓ |
| Net Debt/EBITDA | 0.6x⇑ | 0.5x⇓ | 1.9x⇓ | 4.4x⇑ | 0.3x⇑ |
| Free Operating Cashflow/Interest | 1.5x⇑ | -1.4x⇓ | 3.8x⇑ | 1.1x⇓ | 33.7x⇓ |
| Free Operating Cashflow/Net Debt | 0.5x⇑ | -0.6x⇓ | 0.9x⇑ | 0.1x⇓ | 3.5x⇑ |
| Free Operating Cashflow/Sales | 0.1x⇑ | -0.1x⇓ | 0.7x⇑ | 0.2x⇓ | 0.5x⇑ |
| PROFITABILITY RATIOS | |||||
| Gross Profit Margin | 40.1%⇓ | 45.8%⇓ | 51.5%⇑ | 48.6%⇑ | 47.0%⇑ |
| EBITDA Margin | 31.8%⇓ | 35.0%⇓ | 40.7%⇑ | 36.5%⇓ | 48.1%⇑ |
| EBIT Margin | 26.0%⇓ | 31.3%⇓ | 37.6%⇑ | 31.1%⇓ | 41.6%⇑ |
| PBT Margin | 22.7%⇓ | 30.1%⇑ | 29.4%⇓ | 31.9%⇓ | 41.6%⇑ |
| PAT Margin | 14.7%⇓ | 20.0%⇑ | 19.4%⇓ | 21.4%⇓ | 29.0%⇑ |
| ROAE | 49.1%⇓ | 56.1%⇑ | 34.1%⇑ | 18.6%⇓ | 30.0%⇓ |
| ROAA | 10.0%⇓ | 12.9%⇑ | 9.0%⇑ | 7.0%⇓ | 17.3%⇓ |