| (US$ in Million) | 2024 | 2023 | 2022 | 2021 | 2020 |
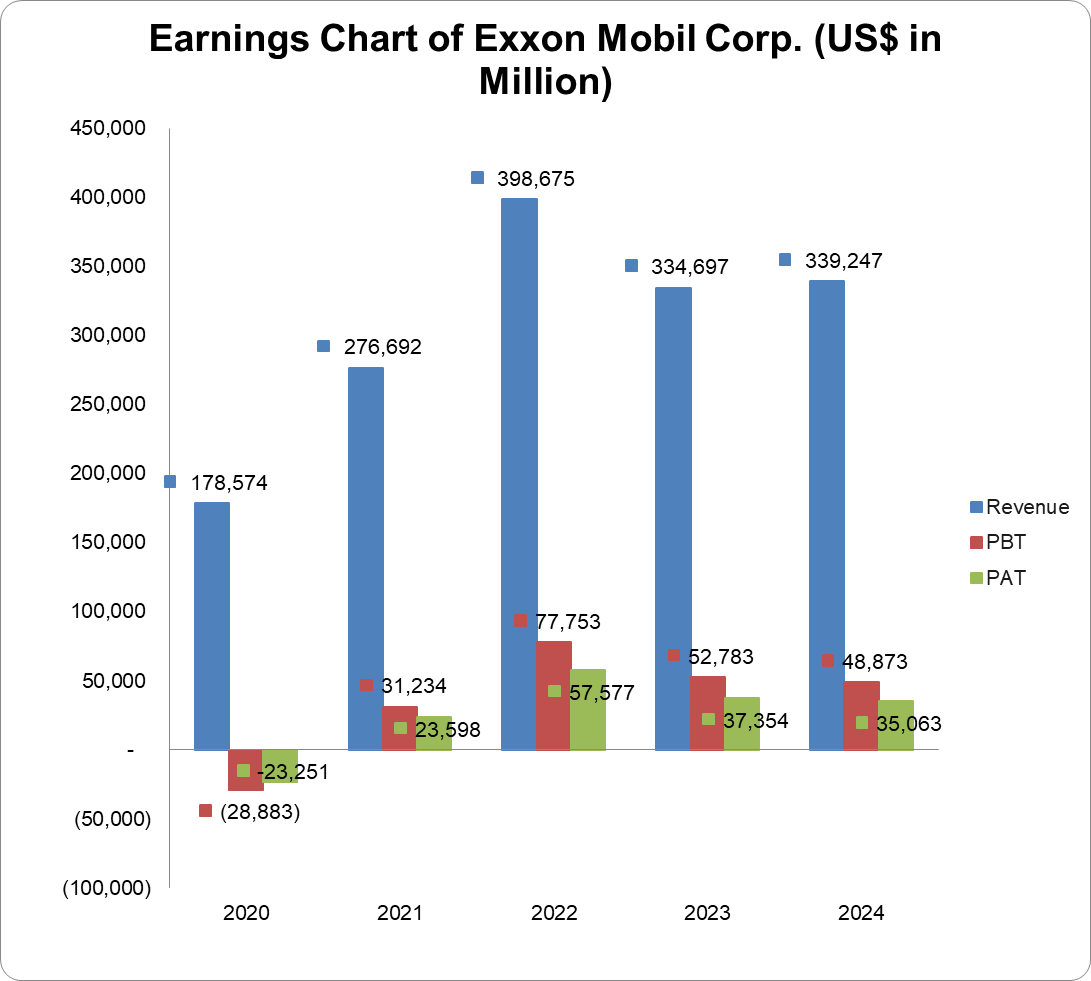
| Turnover | 339,247 | 334,697 | 398,675 | 276,692 | 178,574 |
| Year-on-Year Change | 1.4% | -16.1% | 44.1% | 55.0% | -30.1% |
| Operating Profit | 39,531 | 43,747 | 63,546 | 23,233 | -30,653 |
| Year-on-Year Change | -9.6% | -31.2% | 173.5% | -175.8% | -365.8% |
| EBITDA | 62,973 | 64,388 | 87,586 | 43,840 | 15,356 |
| Year-on-Year Change | -2.2% | -26.5% | 99.8% | 185.5% | -49.7% |
| PBT | 48,873 | 52,783 | 77,753 | 31,234 | -28,883 |
| Year-on-Year Change | -7.4% | -32.1% | 148.9% | -208.1% | -244.0% |
| PAT | 35,063 | 37,354 | 57,577 | 23,598 | -23,251 |
| Year-on-Year Change | -6.1% | -35.1% | 144.0% | -201.5% | -257.4% |
| Total Assets | 453,475 | 376,317 | 369,067 | 338,923 | 332,750 |
| Year-on-Year Change | 20.5% | 2.0% | 8.9% | 1.9% | -8.2% |
| Net Current Assets | 21,683 | 31,293 | 28,586 | 2,511 | -11,470 |
| Year-on-Year Change | -30.7% | 9.5% | 1,038.4% | -121.9% | -17.7% |
| Total Equity | 270,606 | 212,538 | 202,473 | 175,683 | 164,130 |
| Year-on-Year Change | 27.3% | 5.0% | 15.3% | 7.0% | -17.5% |
| Capital Expenditure | 24,306 | 21,919 | 18,407 | 12,076 | 17,282 |
| Year-on-Year Change | 10.9% | 19.1% | 52.4% | -30.1% | -29.1% |
| Funds from Operations | 55,022 | 55,369 | 76,797 | 48,129 | 14,668 |
| Year-on-Year Change | -0.6% | -27.9% | 59.6% | 228.1% | -50.6% |
| Free Operating Cashflow | 30,716 | 33,450 | 58,390 | 36,053 | -2,614 |
| Year-on-Year Change | -8.2% | -42.7% | 62.0% | -1,479.2% | -148.8% |
| Total Debt | 41,710 | 41,573 | 41,193 | 47,704 | 67,640 |
| Year-on-Year Change | 0.3% | 0.9% | -13.7% | -29.5% | 44.2% |
| Net Debt | 18,681 | 10,034 | 11,553 | 40,902 | 63,276 |
| Year-on-Year Change | 86.2% | -13.2% | -71.8% | -35.4% | 44.4% |
| Shares Outstanding (Million) | 4,298 | 4,052 | 4,205 | 4,275 | 4,271 |
| Year-on-Year Change | 6.1% | -3.6% | -1.6% | 0.1% | 0.0% |
| Payout Ratio | 51.4% | 38.3% | 25.8% | 55.7% | -72.9% |
| ⇑ – Year-on-Year Increase | Green: ‘Improved’ |
| ⇓ – Year-on-Year Decrease | Red: ‘Worsened’ |
| ⇔ – Year-on-Year Unchanged |
| 2024 | 2023 | 2022 | 2021 | 2020 | |
| CAPITAL STRUCTURE | |||||
| Total Debt/(Total Debt + Equity) | 13.4%⇓ | 16.4%⇓ | 16.9%⇓ | 21.4%⇓ | 29.2%⇑ |
| Net Debt/Equity | 6.9%⇑ | 4.7%⇓ | 5.7%⇓ | 23.3%⇓ | 38.6%⇑ |
| Debt/Total Assets | 9.2%⇓ | 11.1%⇓ | 11.2%⇓ | 14.1%⇓ | 20.3%⇑ |
| Long Term Debt/Net Earnings | 1.1x⇑ | 1.0x⇑ | 0.7x⇓ | 1.6x⇑ | -2.3x⇓ |
| Current Ratio | 1.3x⇓ | 1.5x⇑ | 1.4x⇑ | 1.0x⇑ | 0.8x⇑ |
| Acid Test Ratio | 1.0x⇓ | 1.1x⇔ | 1.1x⇑ | 0.7x⇑ | 0.5x⇔ |
| CASHFLOW RATIOS | |||||
| Funds from Operations/Total Debt | 1.3x⇔ | 1.3x⇓ | 1.9x⇑ | 1.0x⇑ | 0.2x⇓ |
| Funds from Operations/Net Debt | 3.0x⇓ | 5.5x⇓ | 6.7x⇑ | 1.2x⇑ | 0.2x⇓ |
| EBITDA/Interest | 63.2x⇓ | 75.8x⇓ | 109.8x⇑ | 46.3x⇑ | 13.3x⇓ |
| EBIT/Interest | 39.7x⇓ | 51.5x⇓ | 79.6x⇑ | 24.5x⇑ | -26.5x⇓ |
| Net Debt/EBITDA | 0.3x⇑ | 0.2x⇑ | 0.1x⇓ | 0.9x⇓ | 4.1x⇑ |
| Free Operating Cashflow/Interest | 30.8x⇓ | 39.4x⇓ | 73.2x⇑ | 38.1x⇑ | -2.3x⇓ |
| Free Operating Cashflow/Net Debt | 1.6x⇓ | 3.3x⇓ | 5.1x⇑ | 0.9x⇑ | -0.0x⇓ |
| Free Operating Cashflow/Sales | 0.1x⇔ | 0.1x⇓ | 0.2x⇑ | 0.1x⇑ | -0.0x⇓ |
| PROFITABILITY RATIOS | |||||
| Gross Profit Margin | 22.7%⇓ | 25.2%⇓ | 25.8%⇑ | 23.4%⇑ | 4.3%⇓ |
| EBITDA Margin | 18.6%⇓ | 19.2%⇓ | 22.0%⇑ | 15.8%⇑ | 8.6%⇓ |
| EBIT Margin | 11.7%⇓ | 13.1%⇓ | 15.9%⇑ | 8.4%⇑ | -17.2%⇓ |
| PBT Margin | 14.4%⇓ | 15.8%⇓ | 19.5%⇑ | 11.3%⇑ | -16.2%⇓ |
| PAT Margin | 10.3%⇓ | 11.2%⇓ | 14.4%⇑ | 8.5%⇑ | -13.0%⇓ |
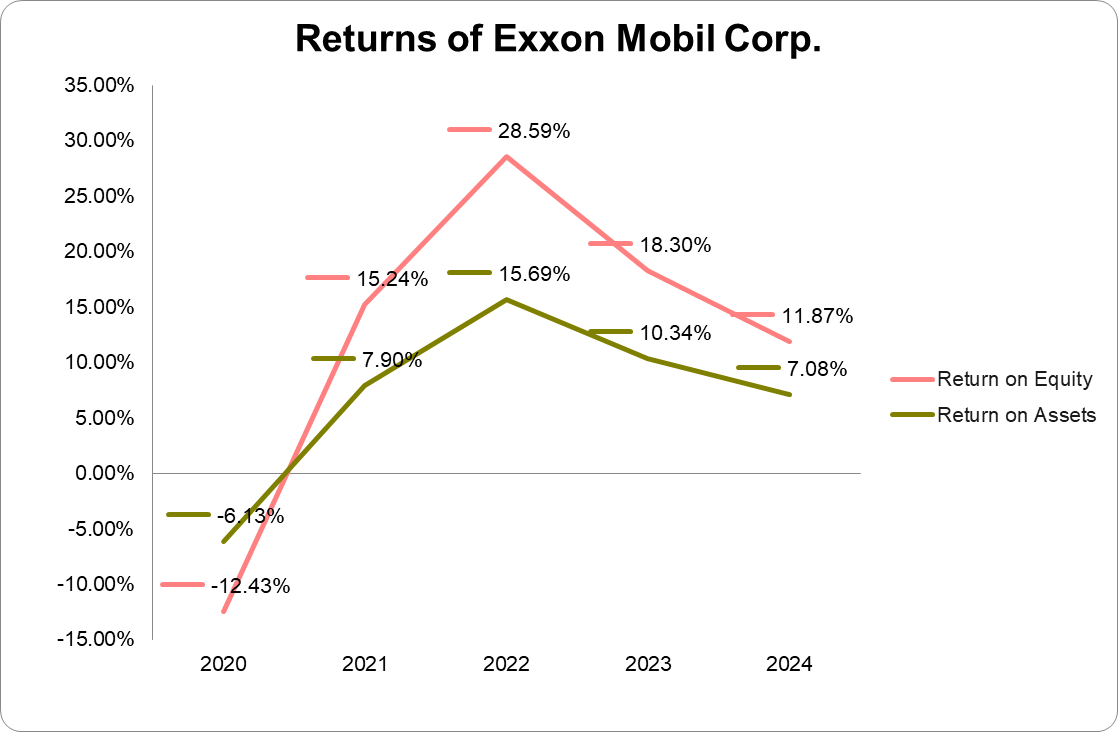
| ROAE | 13.3%⇓ | 18.7%⇓ | 30.6%⇑ | 15.8%⇑ | -11.2%⇓ |
| ROAA | 7.7%⇓ | 10.4%⇓ | 16.4%⇑ | 8.0%⇑ | -5.9%⇓ |