| Ticker: DPC | Nature of Business: Aerospace & Defence | Location: UK |
| Recent Price: $47.15 | 52-Week High/Low: $49.35/42.90 | Estimated Fair Value: $25.39 -$31.35 |
| Expected Return: 31% | Consider Buy: Below $28.37 | Business Risk: High |
| Financial Risk: High | Economic Moat: Weak | Corporate Governance: Strong |
Company Overview
DPC Holdings Plc (DPC), a company headquartered in the United Kingdom, was founded in 2020 as the holding company of Doncasters Group Limited (DONCASTERS). DONCASTERS is a metallurgical company whose establishment dates back to 1778. Currently, it has production facilities in six countries where it produces parts for aeroengines, industrial gas turbines, and automobiles. Its products include airframe structural castings, engine structural castings, air-melted superalloys, turbochargers, blades and vanes. DPC’s shares were listed on the New York Stock Exchange in June 2026.
As a vertically integrated company, it can meet its demand for the superalloys it uses for making aerospace and industrial gas turbine components. The company’s superalloy manufacturing facilities are sited in the USA, Germany, and the United Kingdom.
DPC’s nine-member board of directors is co-chaired by Dirkson Charles and Nicholas Sanders. Dirkson worked as CFO and executive vice president of McKechnie Aerospace before establishing Loar Group Inc., a manufacturer of defence and aerospace components. Nicholas brings to bear his decades-long aerospace experience on the company. Michael Joseph Quinn, the chief executive officer, leads the management team of DPC.
Investment Thesis
DPC is a leading producer of complex precision cast components for aerospace engines, industrial gas turbines, and automobiles. DPC boasts of considerable technological and metallurgical expertise that has been accumulated over a period of about two and a half centuries. Its patent portfolio and many registered trademarks are a testament to its competitive edge in the market. In addition, it has built cordial customer relationships, resulting in the signing of multi-year supply agreements with some Original Equipment Manufacturer (OEM) customers. The order backlog at the end of Quarter 1 of 2026 was $930 million.
The company serves three major markets, namely aerospace, transport and industrial gas turbines (IGT). Rising demand for cleaner power is boosting demand for industrial gas turbine components. Sales to the IGT market in 2025 expanded by 25.4% compared to the previous year, while revenue to aerospace gained 9% year-on-year. In addition, the growing spending on defence and space missions should continue to rub off on suppliers of engine components to the aerospace industry, including DONCASTERS. The sales revenue to the industrial gas turbine market of $351 million was 41.9% of the company’s total revenue. The aerospace market produced a revenue of $291 million or 34.8% of total revenue in 2025.
The capacity to internally produce the superalloys for its aerospace and industrial gas turbines markets is a plus for the management. The aerospace and industrial gas turbine markets together accounted for 76.7% of the company’s total revenue in the 2025 fiscal year (2024: 73.3%). This is capable of helping the company achieve cost savings and improve profit margins going forward. Also, it is not susceptible to supply chain volatility, which may disrupt its operations.
DPC has been investing in capacity expansion and upgrades to achieve economies of scale, reduce costs, and improve profitability. It has spent a total $170 million on capital expenditure since 2020.
Even though the markets it serves have the potential to grow, the financial performance of the company has been below par. The company has been bedevilled by high costs and capital requirements. It has not been a profitable business. Accumulated deficit reached $936 million at the end of the 2025 fiscal year. This was responsible for a negative total equity of $964 million in 2025, up by 22% from the previous year’s figure of -$790 million. That made capital injection necessary even though it would dilute the shareholding of existing shareholders. Additional paid-in capital was $774 million at the end of the first quarter of 2026. Long-term borrowing was also paid down as it stood at $549 million at the end of the 1st quarter of 2026, as against $1.3 billion posted at the end of the 2025 financial year.
DPC has been finding it hard to generate enough operating profit or cash flow to pay its debt. The debt profile could worsen because it would need to finance capital to meet the demand for its products. The company may run into choppy waters if there is no improved working capital management. We do not have a reason to believe that the company’s long-term viability is impaired. However, the unappealing financial performance of DPC is a cause for concern. We would like to monitor the company to see how the management turns the company’s fortunes around in the medium term.
Valuation
A share of DPC is worth between $25.39 and $31.35. The anticipated return on the share is 31%.
Financial Overview
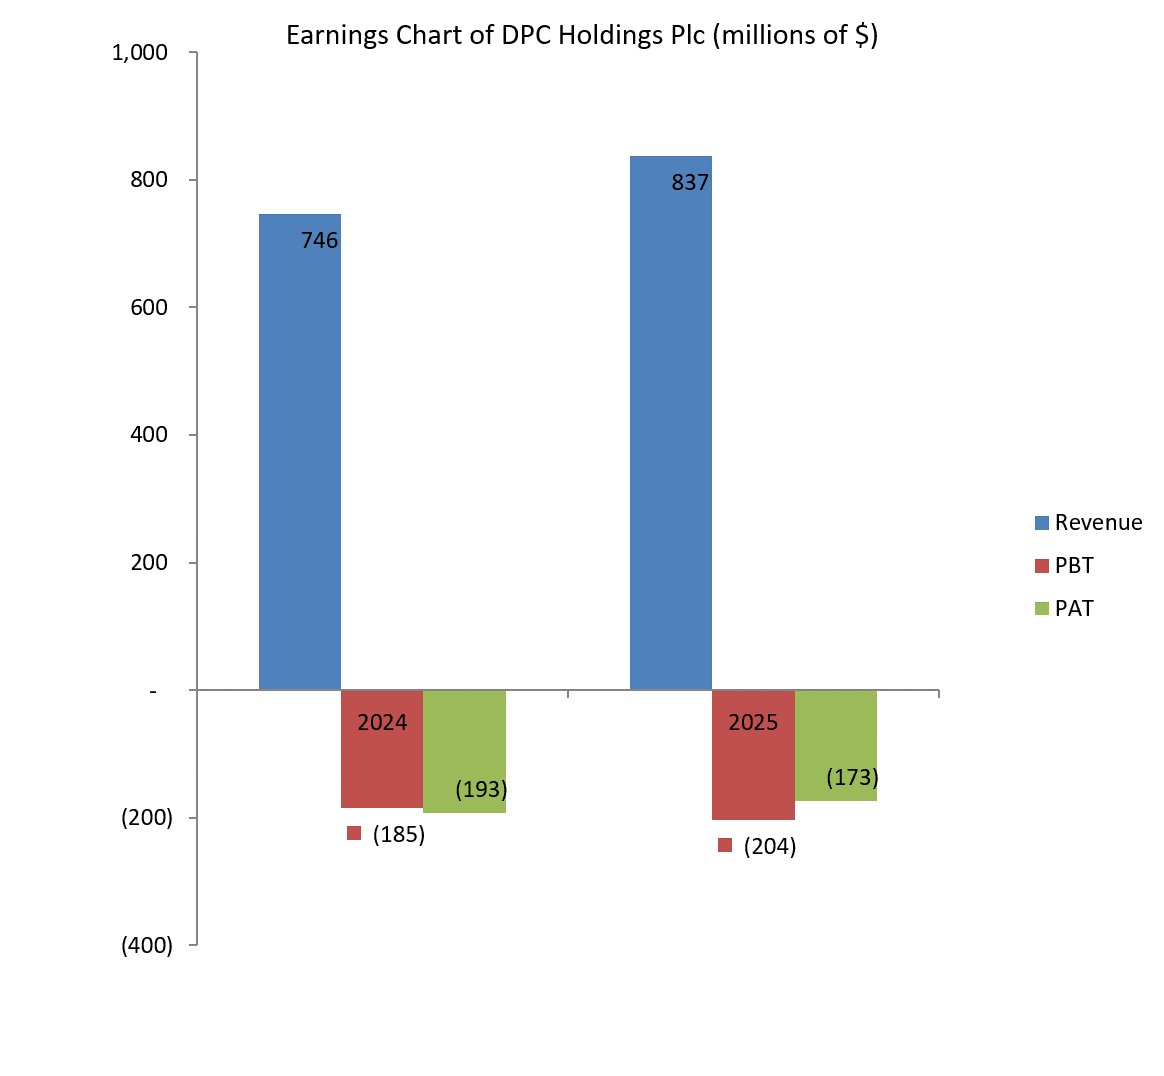
The company operates three business segments, namely Engine Products-Europe, Engine Products-North America and Turbo Wheels. Engine Products-Europe manufactures precision cast components and superalloys for customers in Europe. Engine Products-North America makes and distributes precision cast components and superalloys in North America. The Turbo Wheels segment makes turbocharger wheels and other precision components for vehicles. In 2025, the total revenue leapt by 12.2% to $837 million compared to the previous year, 2024. The revenue increase was largely driven by the Engine Products-Europe division, which accounted for 45.3% of total revenue (2024:40.9%). The sales revenue of $387 million from Engine Products-Europe in 2025 was tantamount to a 22.5% year-on-year increase. Likewise, Engine Products-North America gained a revenue of $23 million or 8.9% year-on-year. The Turbo Wheels sales dropped 5.6% compared to the prior year.
The company’s profit margins are unattractive due to huge costs. Total expenses grew faster than revenue, causing an operating loss in the year. It declared an operating loss of $5 million in 2025 as against an operating profit of $31 million in the 2024 fiscal year. In other words, operating profit recorded a 116.1% dip in a year. Similarly, Loss Before Tax increased to $204 million, which amounted to a 10.3% rise compared to the earlier year. Loss After Tax was $173 million, 10.4% better than a year ago. The interest expense in 2025 was $222 million while it made an operating loss of $5 million. In the earlier year, the operating profit of $31 million was far too low to cover the interest expense of $203 million. Though net operating cash flow improved from -$17 million to $42 million, it was not enough to cover the interest expense for the year.
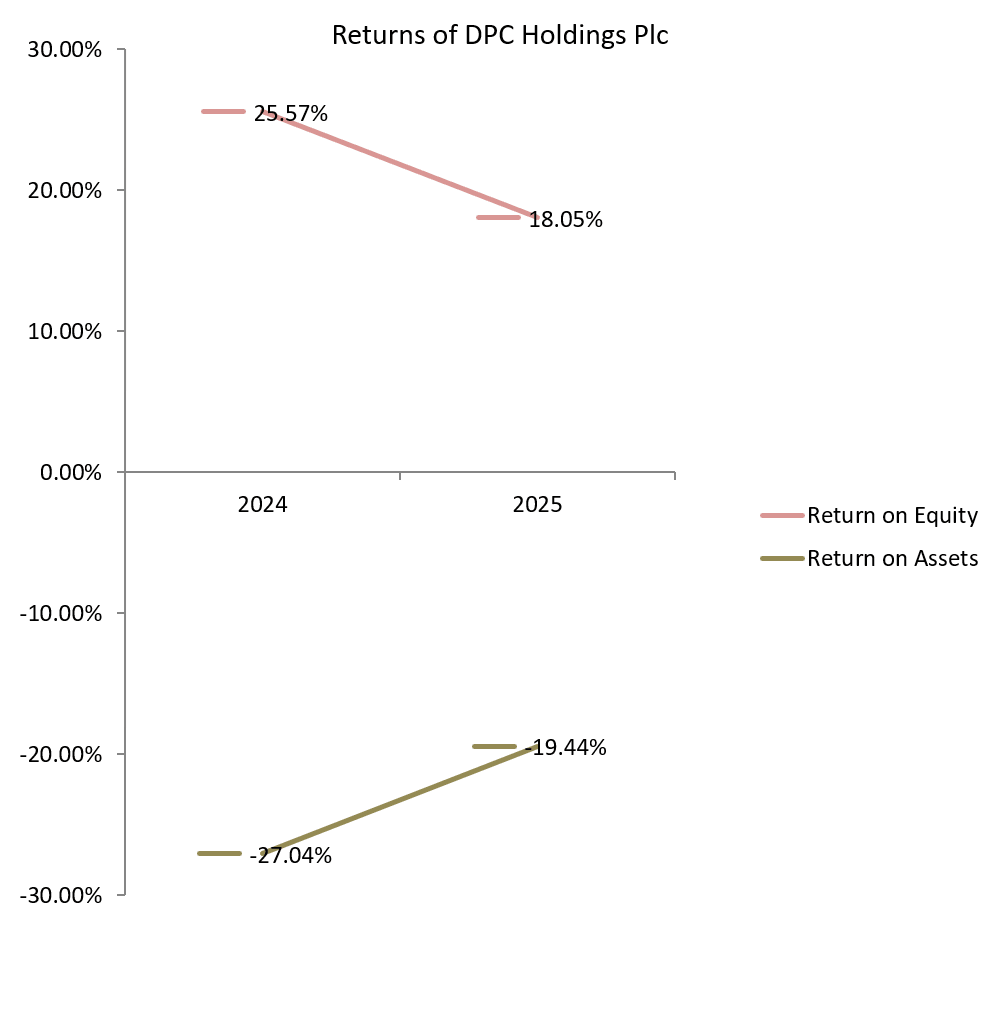
The gross profit margin added 4.2 percentage points due to a fall in the cost of sales to turnover ratio to 76.9% in 2025 from 81.1% in 2024. Profit Before Tax margin stood at -24.4% (2024: -24.8%) while Profit After Tax margin was -20.7% (2024: -25.9%). Total equity in 2024 and 2025 was negative owing to huge accumulated losses. Total debt of $1.5 billion amounted to 162% of total assets (2024:174.4%) and -150.4% of total equity (2024: -164.9%). The company finds it difficult to meet its debt obligations as operating profit and cash flow from operations are grossly inadequate to pay the interest on its debt.
Business Risk
DPC has to comply with regulations in multiple countries. The regulatory compliance, coupled with the high cost of sales, is responsible for low profit margins. Furthermore, the high capital requirement of the business could increase the company’s indebtedness.
DPC should diversify its customer base as it relies on a limited number of customers. The company risks a huge fall in revenue if it fails to secure new contracts from the existing customers.
Recommendation: Overpriced
| ($ in Million) | 2025 | 2024 | 2023 | 2022 | 2021 |
| Turnover | 837 | 746 | |||
| Year-on-Year Change | 12.2% | ||||
| Operating Profit | -5 | 31 | |||
| Year-on-Year Change | -116.1% | ||||
| EBITDA | 27 | 63 | |||
| Year-on-Year Change | -57.1 | ||||
| PBT | -204 | -185 | |||
| Year-on-Year Change | 10.3% | ||||
| PAT | -173 | -193 | |||
| Year-on-Year Change | -10.4% | ||||
| Total Assets | 895 | 747 | |||
| Year-on-Year Change | 19.8% | ||||
| Net Current Assets | -85 | 127 | |||
| Year-on-Year Change | -166.9% | ||||
| Total Equity | -964 | -790 | |||
| Year-on-Year Change | 22.0% | ||||
| Capital Expenditure | 31 | 37 | |||
| Year-on-Year Change | -16.2% | ||||
| Funds from Operations | 42 | -17 | |||
| Year-on-Year Change | –347.1% | ||||
| Free Operating Cashflow | 11 | -54 | |||
| Year-on-Year Change | -120.4% | ||||
| Total Debt | 1,450 | 1,303 | |||
| Year-on-Year Change | 11.3% | ||||
| Net Debt | 1,418 | 1,278 | |||
| Year-on-Year Change | 11.0% | ||||
| Shares Outstanding-ordinary shares (Million) | 113 | 113 | |||
| Year-on-Year Change | 0.0% | ||||
| Payout Ratio | 0.0% | 0.0% |
| ⇑ – Year-on-Year Increase | Green: ‘Improved’ |
| ⇓ – Year-on-Year Decrease | Red: ‘Worsened’ |
| ⇔ – Year-on-Year Unchanged |
| 2025 | 2024 | 2023 | 2022 | 2021 | |
| CAPITAL STRUCTURE | |||||
| Total Debt/(Total Debt + Equity) | 298.4%⇑ | 254.0% | |||
| Net Debt/Equity | -147.1%⇑ | -161.8% | |||
| Debt/Total Assets | 162.0%⇓ | 174.4% | |||
| Long Term Debt/Net Earnings | -7.4x⇓ | -6.3x | |||
| Current Ratio | 0.8x⇓ | 1.6x | |||
| Acid Test Ratio | 0.5x⇓ | 0.9x | |||
| CASHFLOW RATIOS | |||||
| Funds from Operations/Total Debt | 0.0x⇔ | 0.0x | |||
| Funds from Operations/Net Debt | 0.0x⇔ | 0.0x | |||
| EBITDA/Interest | 0.1x⇓ | 0.3x | |||
| EBIT/Interest | 0.0x⇓ | 0.2x | |||
| Net Debt/EBITDA | 52.5x⇓ | 20.3x | |||
| Free Operating Cashflow/Interest | 0.1x⇑ | -0.3x | |||
| Free Operating Cashflow/Net Debt | 0.0x⇔ | 0.0x | |||
| Free Operating Cashflow/Sales | 0.0x⇑ | -0.1x | |||
| PROFITABILITY RATIOS | |||||
| Gross Profit Margin | 23.1%⇑ | 18.9% | |||
| EBITDA Margin | 3.2%⇓ | 8.5% | |||
| EBIT Margin | -0.6%⇓ | 4.2% | |||
| PBT Margin | -24.4%⇑ | -24.8% | |||
| PAT Margin | -20.7%⇑ | -25.9% | |||
| ROAE | 19.8%⇑ | 51.1% | |||
| ROAA | -21.2%⇑ | -54.1% |