| Ticker: | Nature of Business: Refining & Petrochemicals | Location: Nigeria |
| Recent Price: NGN525.00 | 52-Week High/Low: | Estimated Fair Value: NGN427.58 – NGN545.15 |
| Expected Return: 30.1% | Consider Buy: Below NGN545.15 | Business Risk: Medium |
| Financial Risk: Medium | Economic Moat: Wide | Corporate Governance: Strong |
Company Overview
Dangote Petroleum Refinery & Petrochemicals FZE (DPRP) is a refining and petrochemical company domiciled in Lagos State, Nigeria. It started commercial operations in January 2024 following the completion of the refinery in May 2023. It is the largest single-train refinery in the world with a refinery capacity of 700,000 bpd and a petrochemical capacity of 830,000 tpa of polypropylene. The company launched an Initial Public Offering (IPO) on the Nigerian Stock Exchange in September 2026.
The company is planning to spend on capacity expansion to achieve cost savings and operational efficiency. It intends to double its refinery capacity to 1.4 million bpd by 2029 and increase its polypropylene production capacity to 2.4 million tpa by 2030.
Dangote Oil Refining Company and Dangote Industries Limited are the largest shareholders with shareholdings of 65.8% and 14.9% respectively.
Aliko Dangote is the chairman of the 10-man board of directors, while David Bird is the chief executive officer of the company. Mr. David was formerly the chief executive officer of Duqm Refinery & Petrochemical Company (OQ8) in Oman. OQ8 is a joint venture between Oman and Kuwait with a capacity of 230,000 barrels per day. David brings to bear on DPRP his extensive experience in the global energy market.
Investment Thesis
The company is strategically located in the Dangote Industries Free Zone (DIFZ) in Lagos, Nigeria, from where it supplies Nigeria and foreign markets such as the United States, Togo, Ghana, Cameroon, South Africa, Morocco, Brazil, Singapore, Oman, and Malaysia. The company aims to reduce Nigeria’s dependence on imported refined petroleum products and meet the growing demand in Africa.
DPRP is an integrated business with facilities for crude oil refining, petrochemical production, storage, and transportation. The company is seeking finance to expand its capacity to achieve cost savings and improve its profit margins. It is relying on both equity and debt financing. Its 2026 IPO is expected to increase its issued capital by 4.1 billion and raise net proceeds of NGN2.1 trillion ($1.6 billion).
PMS (Premium Motor Spirit or petrol), AGO (Automotive Gas Oil or diesel) and ATF (Aviation Turbine Fuel or jet fuel) are the major revenue sources, but PMS remains the highest contributor to total revenue. Investment in its petrochemical facility is expected to broaden its product portfolio going forward. Polypropylene, its petrochemical product, is a type of heat-resistant plastic material used in automotive components, packaging, medical devices, and other industrial applications.
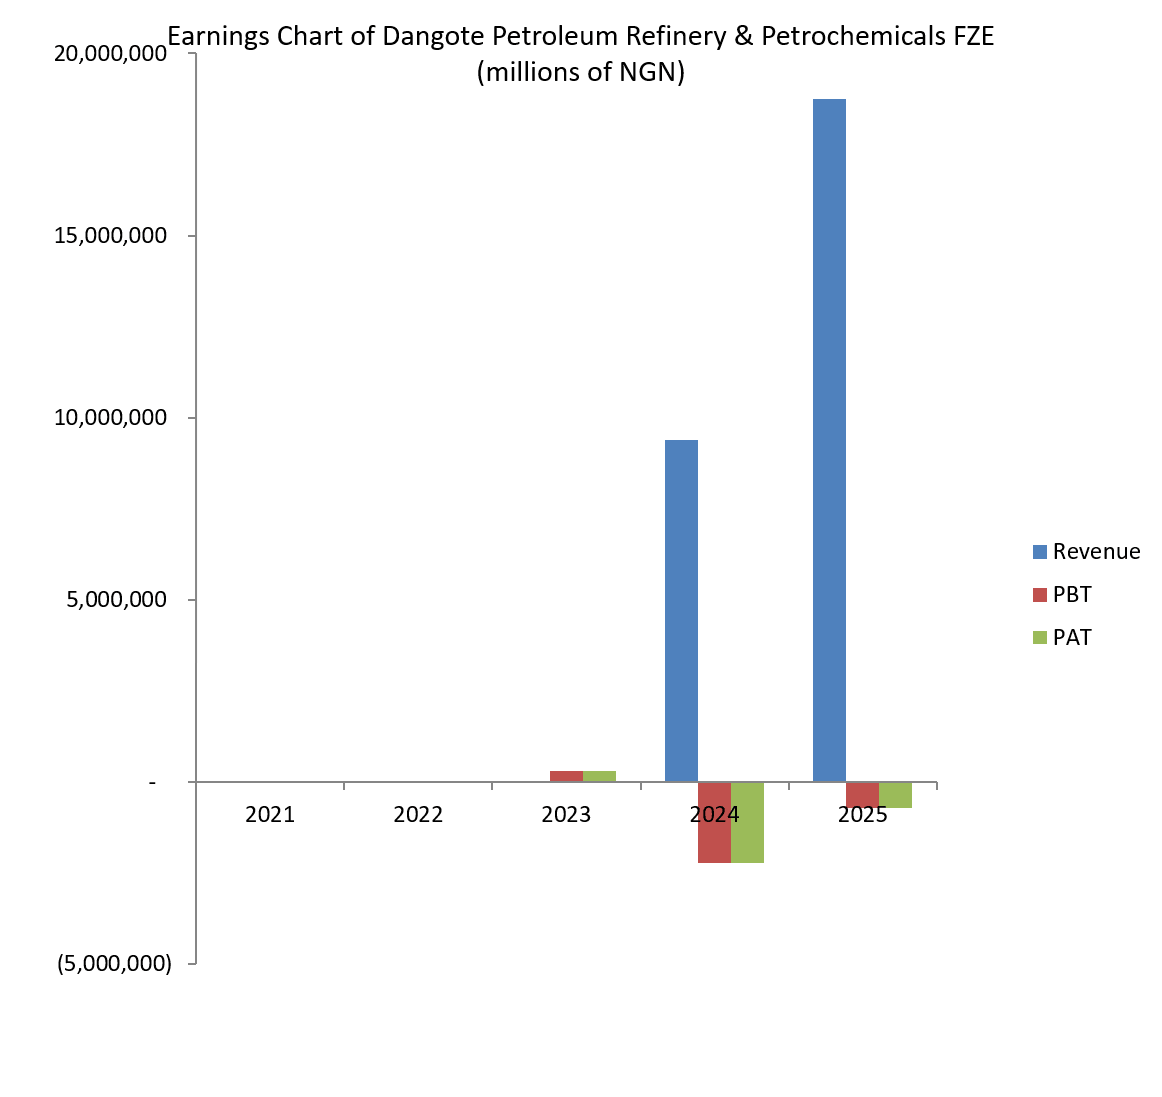
Greater capacity utilisation has improved the company’s financial performance. The first half of 2026 produced revenue of NGN19.1 trillion, 2.1% higher than sales for the whole of 2025. The gross profit for the six months ended 30 June 2026 was NGN3.4 trillion compared with NGN348.4 billion in the 2025 full year. The company, which declared Loss Before Tax and Loss After Tax in 2024 and 2025, made a Profit Before Tax (PBT) of NGN2.9 trillion and Profit After Tax (PAT) of NGN2.5 trillion in the first half of 2026. The negative PBT and PAT margins in the previous years became 15.1% and 13.1% in the first six months of 2026. The debt-to-total equity and debt-to-total assets ratios dropped to 53.3% (2025 full year: 102.4%) and 26.9% (2025 full year: 40.3%).
We expect capacity expansion to further drive down costs and improve profitability going forward. However, the company’s indebtedness could rise due to increased borrowing. Also, its share issues through both private placement and IPO could cause dilution for the existing shareholders of the company. Increasing capital expenditure could reduce the free cash flow generated by the company.
DPRP is being positioned to take advantage of the inadequate refining capacity in Africa. Its expansion drive would increase its revenue-generating capacity, meet strong demand for refined petroleum products and reduce its costs. Investors stand to benefit from owning the company’s shares in the medium term.
Valuation
The company has an adjusted Earnings Power Value (EPV) of NGN331.48. Our fair value estimate for a share of DPRP ranges from NGN427.58 to NGN545.15.
Financial Overview
DPRP produced at full capacity for the first time in 2025. This was responsible for a remarkable improvement in its performance in the 2025 fiscal year. The company posted revenue of NGN18.7 trillion in 2025, which was 99.7% higher than the prior year’s figure. The three major contributors to total revenue are PMS, AGO and ATK. Together, they accounted for 86.1% of total revenue for 2025 as against 67.1% in the previous year. PMS produced revenue of NGN7.5 trillion, or 40% of total revenue in 2025 compared to NGN1.4 trillion or 14.5% of total revenue in 2024. Succinctly put, PMS sales jumped by 452.2% year-on-year.
AGO sales leaped by 43.7% year-on-year to NGN4.2 trillion, while ATK sales more than doubled the previous year’s revenue to NGN4.4 trillion. DPRP recorded Polypropylene sales of NGN31.9 billion from its petrochemical facility in 2025 (2024: nil).
The company declared a gross profit of NGN348.4 billion in 2025 as against a gross loss of NGN887.8 billion in 2024, even though cost of sales rose by 79.1% year-on-year. The gross profit margin of 1.9% was low owing to a huge cost of sales. The cost of sales was 98.1% of total revenue (2024: 109.5%). The operating profit amounted to NGN114.6 billion as against an operating loss of NGN972 billion in the previous year (2024). However, the company could not make a positive Profit Before Tax (PBT) owing to a huge finance cost of NGN979.1 billion. The PBT was -NGN723.1 billion in 2025 compared with -NGN2.2 trillion in the prior year.
A NGN9.3 trillion deposit for shares caused shareholders’ fund to rise from NGN889.2 billion in 2024 to NGN8.8 trillion in 2025. Total assets fell by4.6% to NGN22.4 trillion at 2025 year-end. The company’s total debt stood at NGN9 trillion at the end of the 2025 fiscal year. But it was equivalent to 40.3% of total assets compared to 14.7% in the earlier year. The total debt to shareholders’ fund amounted to 102.4%. The company generates enough operating profit and cash flow to cover its interest expense. We do not have any reason to believe that the company cannot meet its debt obligations or has an impaired long-term viability.
Business Risk
DPRP faces a regulatory risk as the Nigerian petroleum industry is highly regulated. The regulations that are applicable to the oil refining and petrochemicals sector include Health, Safety and Environment (HSE) regulations. Also, crude oil price volatility can have an adverse impact on the company’s profit margins. The company faces exchange rate risk as it sources its crude oil from both domestic and international markets. Besides, crude oil shortages could hamper its operations, raise its costs, and result in losses.
Recommendation: Fairly priced
| (NGN in Millions) | 2025 | 2024 | 2023 | 2022 | 2021 |
| Turnover | 18,737,977 | 9,380,990 | |||
| Year-on-Year Change | 99.7% | N/A | |||
| Operating Profit | 114,637 | -972,017 | -93,592 | -29,555 | -15,038 |
| Year-on-Year Change | -111.8% | 938.6% | 216.7% | 96.5% | N/A |
| EBITDA | 720,667 | -660,394 | -74,497 | -18,082 | -5,561 |
| Year-on-Year Change | -209.1% | 786.5% | 312.0% | 225.2% | N/A |
| PBT | -723,056 | -2,233,179 | 289,359 | -33,432 | -8,353 |
| Year-on-Year Change | -67.6% | -871.8% | -965.5% | 300.2% | N/A |
| PAT | -723,056 | -2,233,179 | 289,359 | -33,432 | -8,353 |
| Year-on-Year Change | -67.6% | -871.8% | -965.5% | 300.2% | N/A |
| Total Assets | 22,395,799 | 23,462,710 | 12,044,574 | 4,999,248 | 3,424,171 |
| Year-on-Year Change | -4.6% | 94.8% | 140.9% | 46.0% | N/A |
| Net Current Assets | -7,302,568 | -17,605,539 | -9,593,673 | -4,210,708 | -2,745,723 |
| Year-on-Year Change | -58.5% | 83.5% | 127.8% | 53.4% | N/A |
| Total Equity | 8,828,355 | 889,184 | 1,983,406 | 763,120 | 566,753 |
| Year-on-Year Change | 892.9% | -55.2% | 159.9% | 34.7% | N/A |
| Capital Expenditure | 172,660 | 242,967 | 412,301 | 625,556 | 573,644 |
| Year-on-Year Change | -28.9% | -41.1% | -34.1% | 9.1% | N/A |
| Funds from Operations | 1,819,984 | -3,857,303 | 412,799 | 625,436 | 573,282 |
| Year-on-Year Change | -147.2% | -1,034.4% | -34.0% | 9.1% | N/A |
| Free Operating Cashflow | 1,647,324 | -4,100,270 | 498 | -120 | -362 |
| Year-on-Year Change | -140.2% | -823,447.4% | -515.0% | -66.9% | N/A |
| Total Debt | 9,035,562 | 3,448,682 | |||
| Year-on-Year Change | 162.0% | N/A | |||
| Net Debt | 7,479,207 | 2,965,069 | -729 | -60 | -179 |
| Year-on-Year Change | 152.2% | -406,831.0% | 1,115.0% | -66.5% | N/A |
| Shares Outstanding-ordinary shares (Million) | 112,981 | 112,981 | 112,981 | ||
| Year-on-Year Change | 0.0% | 0.0% | N/A | ||
| Payout Ratio | N/A | N/A | N/A |
| ⇑ – Year-on-Year Increase | Green: ‘Improved’ |
| ⇓ – Year-on-Year Decrease | Red: ‘Worsened’ |
| ⇔ – Year-on-Year Unchanged |
| 2025 | 2024 | 2023 | 2022 | 2021 | |
| CAPITAL STRUCTURE | |||||
| Total Debt/(Total Debt + Equity) | 50.6%⇓ | 79.5% | |||
| Net Debt/Equity | 84.7%⇓ | 333.5% | |||
| Debt/Total Assets | 40.3%⇑ | 14.7% | |||
| Long Term Debt/Net Earnings | -1.2x⇓ | 0.0x | |||
| Current Ratio | 0.4x⇑ | 0.2x⇑ | 0.1x⇑ | 0.0x⇔ | 0.0x⇔ |
| Acid Test Ratio | 0.3x⇑ | 0.1x⇑ | 0.0x⇔ | 0.0x⇔ | 0.0x⇔ |
| CASHFLOW RATIOS | |||||
| Funds from Operations/Total Debt | 0.2x⇑ | -1.1x | |||
| Funds from Operations/Net Debt | 0.2x⇑ | -1.3x⇑ | -566.3x⇑ | -10,423.9x⇓ | -3,202.7x |
| EBITDA/Interest | 0.7x⇑ | -0.5x | |||
| EBIT/Interest | 0.1x⇑ | -0.8x | |||
| Net Debt/EBITDA | 10.4x⇑ | -4.5x⇓ | 0.0x⇔ | 0.0x⇔ | 0.0x⇔ |
| Free Operating Cashflow/Interest | 1.7x⇑ | -3.2x | |||
| Free Operating Cashflow/Net Debt | 0.2x⇑ | -1.4x⇓ | -0.7x⇓ | 2.0x⇔ | 2.0x |
| Free Operating Cashflow/Sales | 0.1x⇑ | -0.4x | |||
| PROFITABILITY RATIOS | |||||
| Gross Profit Margin | 1.9%⇑ | -9.5% | |||
| EBITDA Margin | 3.9%⇑ | -7.0% | |||
| EBIT Margin | 0.6%⇑ | -10.4% | |||
| PBT Margin | -3.9%⇑ | -23.8% | |||
| PAT Margin | -3.9%⇑ | -23.8% | |||
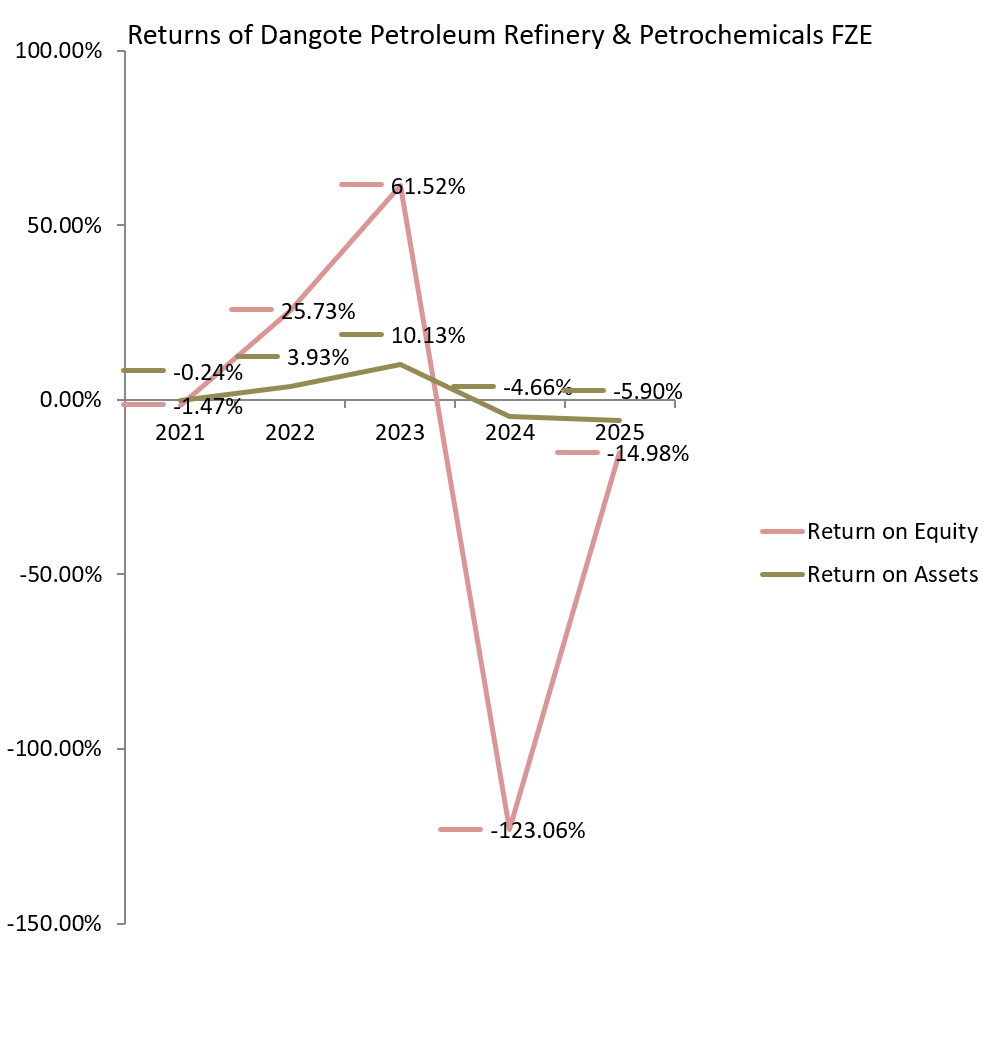
| ROAE | -14.9%⇑ | -155.5%⇓ | 21.1%⇑ | -5.0%⇓ | -3.0% |
| ROAA | -3.2%⇑ | -12.6%⇓ | 3.4%⇑ | -0.8%⇓ | -0.5% |