| (US$ in Million) | 2024 | 2023 | 2022 | 2021 | 2020 |
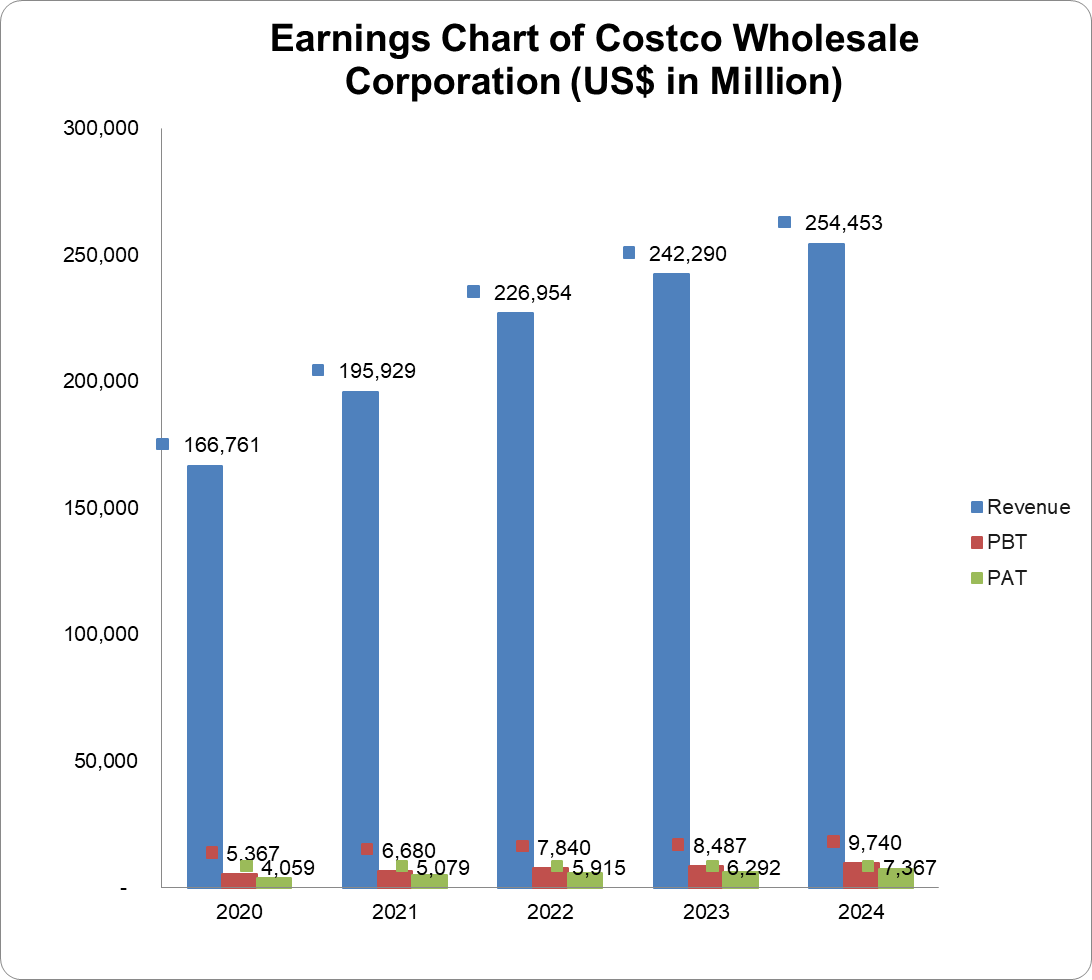
| Turnover | 254,453 | 242,290 | 226,954 | 195,929 | 166,761 |
| Year-on-Year Change | 5.0% | 6.8% | 15.8% | 17.5% | 9.2% |
| Operating Profit | 9,285 | 8,114 | 7,793 | 6,708 | 5,435 |
| Year-on-Year Change | 14.4% | 4.1% | 16.2% | 23.4% | 14.7% |
| EBITDA | 11,522 | 10,191 | 9,693 | 8,489 | 7,080 |
| Year-on-Year Change | 13.1% | 5.1% | 14.2% | 19.9% | 13.7% |
| PBT | 9,740 | 8,487 | 7,840 | 6,680 | 5,367 |
| Year-on-Year Change | 14.8% | 8.3% | 17.4% | 24.5% | 12.6% |
| PAT | 7,367 | 6,292 | 5,915 | 5,079 | 4,059 |
| Year-on-Year Change | 17.1% | 6.4% | 16.5% | 25.1% | 9.6% |
| Total Assets | 69,831 | 68,994 | 64,166 | 59,268 | 55,556 |
| Year-on-Year Change | 1.2% | 7.5% | 8.3% | 6.7% | 22.4% |
| Net Current Assets | -1,218 | 2,296 | 698 | 64 | 3,276 |
| Year-on-Year Change | -153.1% | 228.9% | 990.6% | -98.1% | 1,221.0% |
| Total Equity | 23,622 | 25,058 | 20,647 | 18,078 | 18,705 |
| Year-on-Year Change | -5.7% | 21.4% | 14.2% | -3.4% | 20.0% |
| Capital Expenditure | 4,710 | 4,323 | 3,891 | 3,588 | 3,973 |
| Year-on-Year Change | 9.0% | 11.1% | 8.4% | -9.7% | 32.5% |
| Funds from Operations | 11,339 | 11,068 | 7,392 | 8,958 | 8,861 |
| Year-on-Year Change | 2.5% | 49.7% | -17.5% | 1.1% | 39.4% |
| Free Operating Cashflow | 6,629 | 6,745 | 3,501 | 5,370 | 4,888 |
| Year-on-Year Change | -1.7% | 92.7% | -34.8% | 9.9% | 45.6% |
| Total Debt | 8,272 | 8,884 | 9,039 | 10,133 | 10,167 |
| Year-on-Year Change | -6.9% | -1.7% | -10.8% | -0.3% | 49.0% |
| Net Debt | -1,634 | -4,816 | -1,164 | -1,125 | -2,110 |
| Year-on-Year Change | -66.1% | 313.8% | 3.5% | -46.7% | 35.2% |
| Shares Outstanding (Million) | 444 | 444 | 444 | 443 | 442 |
| Year-on-Year Change | 0.0% | 0.0% | 0.2% | 0.2% | 0.5% |
| Payout Ratio | 117.1% | 27.0% | 28.9% | 109.3% | 28.3% |
| ⇑ – Year-on-Year Increase | Green: ‘Improved’ |
| ⇓ – Year-on-Year Decrease | Red: ‘Worsened’ |
| ⇔ – Year-on-Year Unchanged |
| 2024 | 2023 | 2022 | 2021 | 2020 | |
| CAPITAL STRUCTURE | |||||
| Total Debt/(Total Debt + Equity) | 25.9%⇓ | 26.2%⇓ | 30.5%⇓ | 35.9%⇑ | 35.2%⇑ |
| Net Debt/Equity | -6.9%⇑ | -19.2%⇓ | -5.6%⇑ | -6.2%⇑ | -11.3%⇓ |
| Debt/Total Assets | 11.9%⇓ | 12.9%⇓ | 14.1%⇓ | 17.1%⇓ | 18.3%⇑ |
| Long Term Debt/Net Earnings | 1.1x⇓ | 1.2x⇓ | 1.7x⇓ | 1.8x⇓ | 2.4x⇑ |
| Current Ratio | 1.0x⇓ | 1.1x⇑ | 1.0x⇔ | 1.0x⇓ | 1.1x⇑ |
| Acid Test Ratio | 0.4x⇓ | 0.6x⇑ | 0.5x⇔ | 0.5x⇓ | 0.6x⇑ |
| CASHFLOW RATIOS | |||||
| Funds from Operations/Total Debt | 1.4x⇑ | 1.3x⇑ | 0.8x⇓ | 0.9x⇔ | 0.9x⇔ |
| Funds from Operations/Net Debt | -6.9x⇓ | -2.3x⇑ | -6.4x⇑ | -8.0x⇓ | -4.2x⇓ |
| EBITDA/Interest | 68.2x⇑ | 63.7x⇑ | 61.4x⇑ | 49.6x⇑ | 44.3x⇑ |
| EBIT/Interest | 54.9x⇑ | 50.7x⇑ | 49.3x⇑ | 39.2x⇑ | 34.0x⇑ |
| Net Debt/EBITDA | -0.1x⇑ | -0.5x⇓ | -0.1x⇔ | -0.1x⇑ | -0.3x⇔ |
| Free Operating Cashflow/Interest | 39.2x⇓ | 42.2x⇑ | 22.2x⇓ | 31.4x⇑ | 30.6x⇑ |
| Free Operating Cashflow/Net Debt | -4.1x⇓ | -1.4x⇑ | -3.0x⇑ | -4.8x⇓ | -2.3x⇓ |
| Free Operating Cashflow/Sales | 0.0x⇔ | 0.0x⇔ | 0.0x⇔ | 0.0x⇔ | 0.0x⇔ |
| PROFITABILITY RATIOS | |||||
| Gross Profit Margin | 10.7%⇑ | 10.4%⇑ | 10.3%⇓ | 10.9%⇓ | 11.0%⇑ |
| EBITDA Margin | 4.5%⇑ | 4.2%⇓ | 4.3%⇔ | 4.3%⇔ | 4.3%⇑ |
| EBIT Margin | 3.7%⇑ | 3.4%⇔ | 3.4%⇔ | 3.4%⇑ | 3.3%⇑ |
| PBT Margin | 3.8%⇑ | 3.5%⇔ | 3.5%⇑ | 3.4%⇑ | 3.2%⇑ |
| PAT Margin | 2.9%⇑ | 2.6%⇔ | 2.6%⇔ | 2.6%⇑ | 2.4%⇔ |
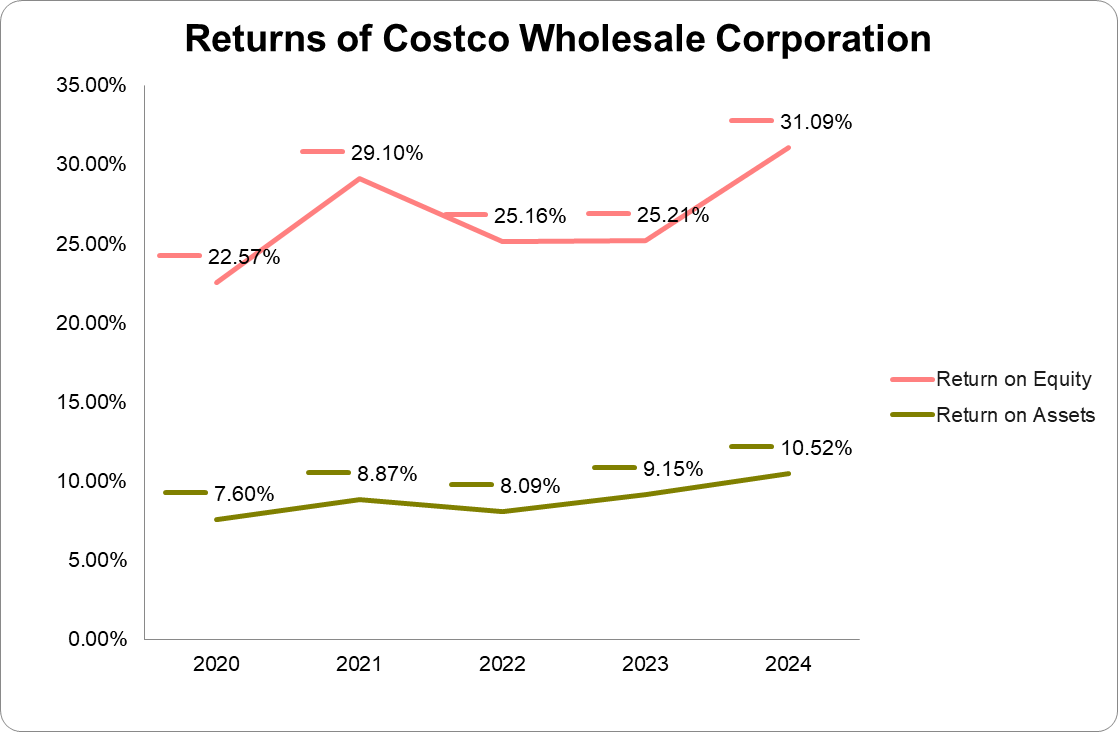
| ROAE | 30.2%⇑ | 27.6%⇑ | 26.8%⇓ | 28.6%⇑ | 24.6%⇓ |
| ROAA | 10.6%⇑ | 9.5%⇑ | 8.4%⇓ | 9.2%⇑ | 8.4%⇓ |