| (US$ in Million) | 2024 | 2023 | 2022 | 2021 | 2020 |
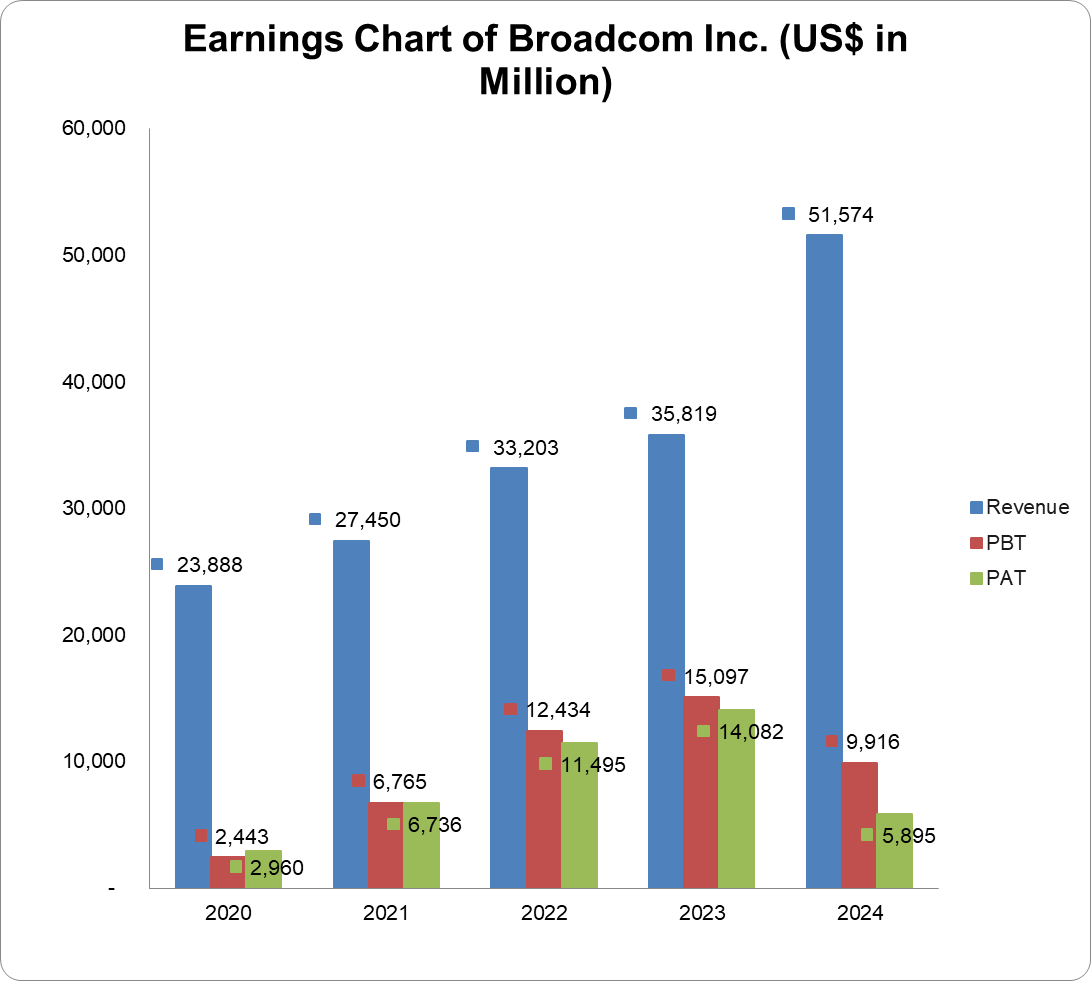
| Turnover | 51,574 | 35,819 | 33,203 | 27,450 | 23,888 |
| Year-on-Year Change | 44.0% | 7.9% | 21.0% | 14.9% | 5.7% |
| Operating Profit | 13,463 | 16,207 | 14,225 | 8,519 | 4,014 |
| Year-on-Year Change | -16.9% | 13.9% | 67.0%% | 112.2% | 16.6% |
| EBITDA | 23,473 | 20,042 | 19,209 | 14,560 | 10,919 |
| Year-on-Year Change | 17.1% | 4.3% | 31.9% | 33.4% | 18.0% |
| PBT | 9,916 | 15,097 | 12,434 | 6,765 | 2,443 |
| Year-on-Year Change | -34.3% | 21.4% | 83.8% | 176.9% | 9.8% |
| PAT | 5,895 | 14,082 | 11,495 | 6,736 | 2,960 |
| Year-on-Year Change | -58.1% | 22.5% | 70.7% | 127.6% | 8.7% |
| Total Assets | 165,645 | 72,861 | 73,249 | 75,570 | 75,933 |
| Year-on-Year Change | 127.3% | -0.55 | -3.1% | -0.5% | 12.5% |
| Net Current Assets | 2,898 | 13,442 | 11,452 | 10,305 | 5,524 |
| Year-on-Year Change | -78.4% | 17.4% | 11.1% | 86.6% | 83.0% |
| Total Equity | 67,678 | 23,988 | 22,709 | 24,962 | 23,874 |
| Year-on-Year Change | 182.1% | 5.6% | -9.0% | 4.6% | -4.3% |
| Capital Expenditure | 26,526 | 505 | 670 | 451 | 11,335 |
| Year-on-Year Change | 5,152.7% | -24.6% | 48.6% | -96.0% | -31.2% |
| Funds from Operations | 19,962 | 18,085 | 16,736 | 13,764 | 12,061 |
| Year-on-Year Change | 10.4% | 8.1% | 21.6% | 14.1% | 24.4% |
| Free Operating Cashflow | -6,564 | 17,580 | 16,066 | 13,313 | 726 |
| Year-on-Year Change | -137.3% | 9.4% | 20.7% | 1,733.8% | -110.7% |
| Total Debt | 67,566 | 39,229 | 39,515 | 39,730 | 41,062 |
| Year-on-Year Change | 72.2% | -0.7% | -0.5% | -3.2% | 25.2% |
| Net Debt | 58,218 | 25,040 | 27,099 | 27,567 | 33,444 |
| Year-on-Year Change | 132.5% | -7.6% | -1.7% | -17.6% | 20.6% |
| Shares Outstanding (Million) | 4,624 | 4,149 | 4,089 | 410 | 402 |
| Year-on-Year Change | 11.5% | 1.5% | 897.3% | 2.0% | 1.0% |
| Payout Ratio | 165.1% | 53.2% | 58.0% | 87.8% | 175.1% |
| ⇑ – Year-on-Year Increase | Green: ‘Improved’ |
| ⇓ – Year-on-Year Decrease | Red: ‘Worsened’ |
| ⇔ – Year-on-Year Unchanged |
| 2024 | 2023 | 2022 | 2021 | 2020 | |
| CAPITAL STRUCTURE | |||||
| Total Debt/(Total Debt + Equity) | 50.0%⇓ | 62.1%⇓ | 63.5%⇑ | 61.4%⇓ | 63.2%⇑ |
| Net Debt/Equity | 86.0%⇓ | 104.4%⇓ | 119.3%⇑ | 110.4%⇓ | 140.1%⇑ |
| Debt/Total Assets | 40.8%⇓ | 53.8%⇓ | 54.0%⇑ | 52.6%⇓ | 54.1%⇑ |
| Long Term Debt/Net Earnings | 11.3x⇑ | 2.6x⇓ | 3.4x⇓ | 5.9x⇓ | 13.5x⇑ |
| Current Ratio | 1.2x⇓ | 2.8x⇑ | 2.6x⇔ | 2.6x⇑ | 1.9x⇑ |
| Acid Test Ratio | 1.1x⇓ | 2.6x⇑ | 2.4x⇔ | 2.4x⇑ | 1.7x⇑ |
| CASHFLOW RATIOS | |||||
| Funds from Operations/Total Debt | 0.3x⇓ | 0.5x⇑ | 0.4x⇔ | 0.4x⇑ | 0.3x⇔ |
| Funds from Operations/Net Debt | 0.3x⇓ | 0.7x⇑ | 0.6x⇑ | 0.5x⇑ | 0.4x⇔ |
| EBITDA/Interest | 5.9x⇓ | 12.4x⇑ | 11.1x⇑ | 7.7x⇑ | 6.1x⇓ |
| EBIT/Interest | 3.4x⇓ | 10.0x⇑ | 8.2x⇑ | 4.5x⇑ | 2.3x⇓ |
| Net Debt/EBITDA | 2.5x⇑ | 1.3x⇓ | 1.4x⇓ | 1.9x⇓ | 3.1x⇑ |
| Free Operating Cashflow/Interest | -1.7x⇓ | 10.8x⇑ | 9.3x⇑ | 7.1x⇑ | 0.4x⇑ |
| Free Operating Cashflow/Net Debt | -o.1x⇓ | 0.7x⇑ | 0.6x⇑ | 0.5x⇑ | 0.0x⇑ |
| Free Operating Cashflow/Sales | -0.1x⇓ | 0.5x⇔ | 0.5x⇔ | 0.5x⇑ | 0.0x⇑ |
| PROFITABILITY RATIOS | |||||
| Gross Profit Margin | 63.0%⇓ | 68.9%⇑ | 66.6%⇑ | 61.4%⇑ | 56.6%⇑ |
| EBITDA Margin | 45.5%⇓ | 56.0%⇓ | 57.9%⇑ | 53.0%⇑ | 45.7%⇑ |
| EBIT Margin | 26.1%⇓ | 45.3%⇑ | 42.8%⇑ | 31.0%⇑ | 16.8%⇑ |
| PBT Margin | 19.2%⇓ | 42.2%⇑ | 37.5%⇑ | 24.6%⇑ | 10.2%⇑ |
| PAT Margin | 11.4%⇓ | 39.3%⇑ | 34.6%⇑ | 24.5%⇑ | 12.4%⇑ |
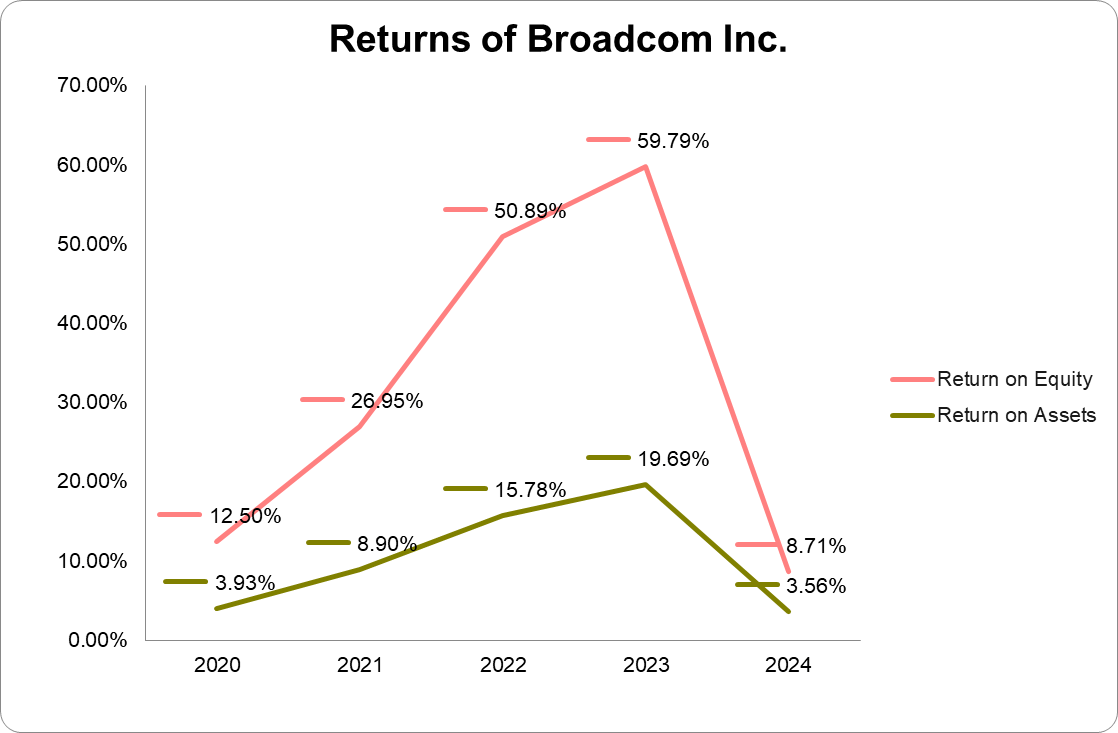
| ROAE | 12.9%⇓ | 61.4%⇑ | 48.5%⇑ | 27.6%⇑ | 12.2%⇓ |
| ROAA | 4.9%⇓ | 19.6%⇑ | 15.5%⇑ | 8.9%⇑ | 4.2%⇓ |