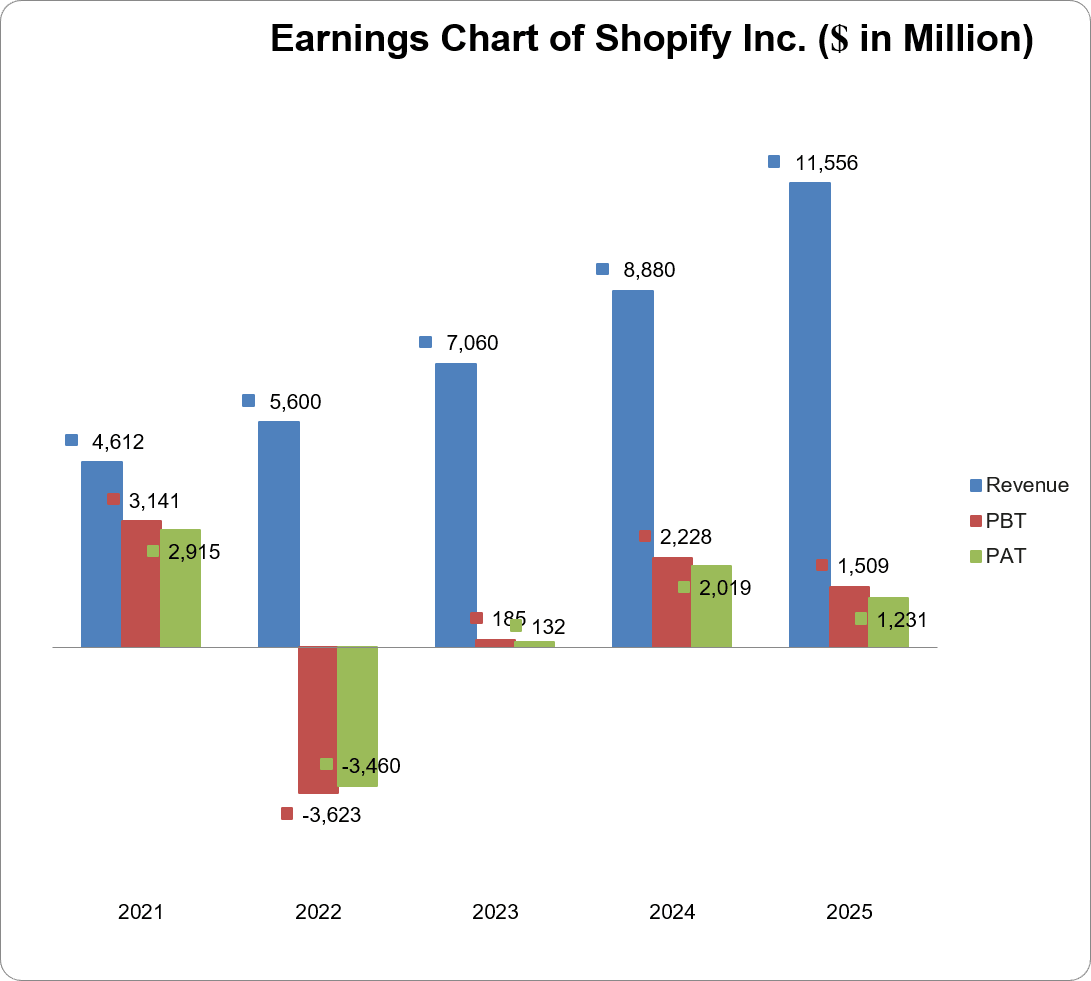
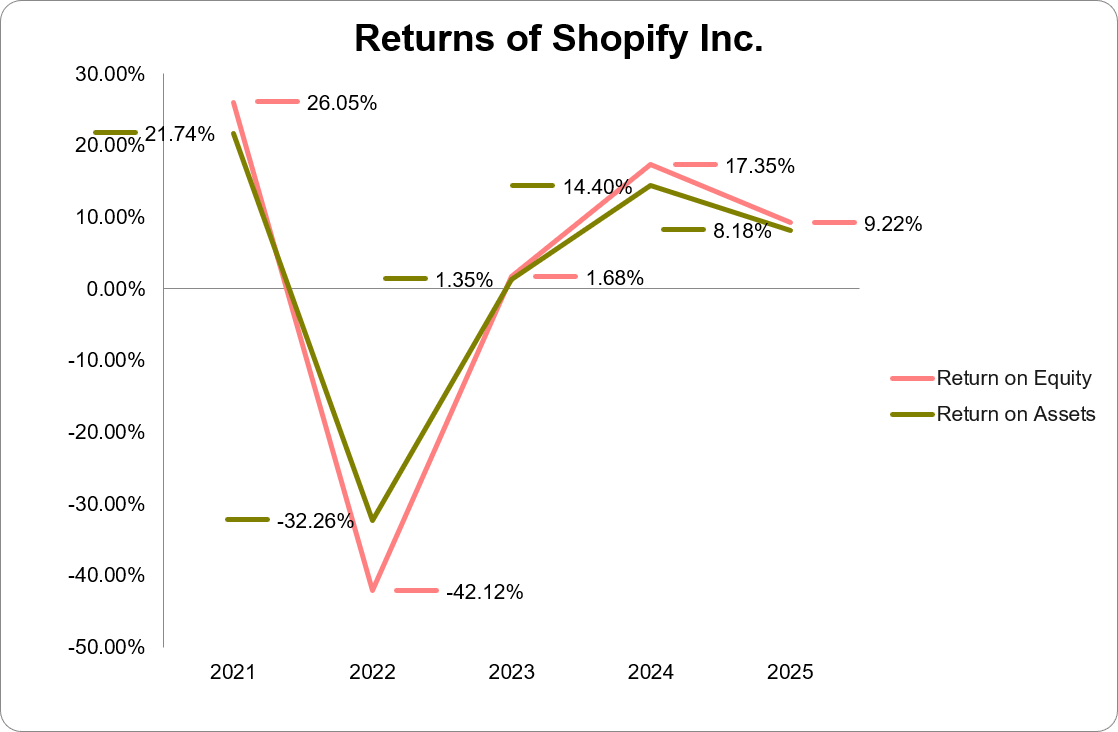
| ($ in Million) | 2025 | 2024 | 2023 | 2022 | 2021 |
| Turnover | 11,556 | 8,880 | 7,060 | 5,600 | 4,612 |
| Year-on-Year Change | 30.1% | 25.8% | 26.1% | 21.4% | 57.5% |
| Operating Profit | 1,468 | 1,075 | -1,418 | -822 | 269 |
| Year-on-Year Change | 36.6% | -175.8% | 72.5% | -405.6% | 198.9% |
| EBITDA | 1,499 | 1,111 | -1,348 | -729 | 269 |
| Year-on-Year Change | 34.9% | -182.4% | 84.9% | -371.0% | 198.9% |
| PBT | 1,509 | 2,228 | 185 | -3,623 | 3,141 |
| Year-on-Year Change | -32.3% | 1,104.3% | -105.1% | -215.4% | 1,208.8% |
| PAT | 1,231 | 2,019 | 132 | -3,460 | 2,915 |
| Year-on-Year Change | -39.0% | 1,429.6% | -103.8% | -218.7% | 810.9% |
| Total Assets | 15,189 | 13,924 | 11,299 | 10,757 | 13,340 |
| Year-on-Year Change | 9.1% | 23.2% | 5.0% | -19.4% | 71.9% |
| Net Current Assets | 6,904 | 5,298 | 5,377 | 5,194 | 7,836 |
| Year-on-Year Change | 30.3% | -1.5% | 3.5% | -33.7% | 21.7% |
| Total Equity | 13,473 | 11,558 | 9,066 | 8,239 | 11,133 |
| Year-on-Year Change | 16.6% | 27.5% | 10.0% | -26.0% | 73.9% |
| Capital Expenditure | 26 | 19 | 39 | 50 | 51 |
| Year-on-Year Change | 36.8% | -51.3% | -22.0% | -2.0% | 21.4% |
| Funds from Operations | 2,033 | 1,616 | 944 | -136 | 504 |
| Year-on-Year Change | 25.8% | 71.2% | -794.1% | -127.0% | 18.6% |
| Free Operating Cashflow | 2,007 | 1,597 | 905 | -186 | 453 |
| Year-on-Year Change | 25.7% | 76.5% | -586.6% | -141.1% | 18.3% |
| Total Debt | 188 | 1,126 | 1,150 | 1,396 | 1,174 |
| Year-on-Year Change | -83.3% | -2.1% | -17.6% | 18.9% | 28.6% |
| Net Debt | -1,357 | -372 | -263 | -253 | -1,329 |
| Year-on-Year Change | 264.8% | 41.4% | 4.0% | -81.0% | -25.8% |
| Shares Outstanding-ordinary shares (Million) | 1,299 | 1,290 | 1,282 | 1,266 | 125 |
| Year-on-Year Change | 0.7% | 0.6% | 1.3% | 912.8% | 4.2% |
| Payout Ratio | 0.0% | 0.0% | 0.0% | 0.0% | 0.0% |
| ⇑ – Year-on-Year Increase | Green: ‘Improved’ |
| ⇓ – Year-on-Year Decrease | Red: ‘Worsened’ |
| ⇔ – Year-on-Year Unchanged |
| 2025 | 2024 | 2023 | 2022 | 2021 | |
| CAPITAL STRUCTURE | |||||
| Total Debt/(Total Debt + Equity) | 1.4%⇓ | 8.9%⇓ | 11.3%⇓ | 14.5%⇑ | 9.5%⇓ |
| Net Debt/Equity | -10.1%⇓ | -3.2%⇓ | -2.9%⇑ | -3.1%⇑ | -11.9%⇑ |
| Debt/Total Assets | 1.2%⇓ | 8.1%⇓ | 10.2%⇓ | 13.0%⇑ | 8.8%⇓ |
| Long Term Debt/Net Earnings | 0.1x⇔ | 0.1x⇓ | 7.5x⇑ | -0.4⇓ | 0.4x⇓ |
| Current Ratio | 6.0x⇑ | 3.7x⇓ | 7.0x⇓ | 7.1x⇓ | 12.2x⇑ |
| Acid Test Ratio | 6.0x⇑ | 3.7x⇓ | 7.0x⇓ | 7.1x⇓ | 12.2x⇑ |
| CASHFLOW RATIOS | |||||
| Funds from Operations/Total Debt | 10.8x⇑ | 1.4x⇑ | 0.8x⇑ | -0.1x⇓ | 0.4x⇓ |
| Funds from Operations/Net Debt | -1.5x⇑ | -4.3x⇓ | -3.6x⇓ | 0.5x⇑ | -0.4x⇓ |
| EBITDA/Interest | |||||
| EBIT/Interest | |||||
| Net Debt/EBITDA | -0.9x⇓ | -0.3x⇓ | 0.2x⇓ | 0.4x⇑ | -4.9x⇓ |
| Free Operating Cashflow/Interest | |||||
| Free Operating Cashflow/Net Debt | -1.5x⇑ | -4.3x⇓ | -3.4x⇓ | 0.7x⇑ | -0.3x⇓ |
| Free Operating Cashflow/Sales | 0.2x⇔ | 0.2x⇑ | 0.1x⇑ | 0.0x⇓ | 0.1x⇔ |
| PROFITABILITY RATIOS | |||||
| Gross Profit Margin | |||||
| EBITDA Margin | |||||
| EBIT Margin | |||||
| PBT Margin | |||||
| PAT Margin | |||||
| ROAE | |||||
| ROAA |