| (£ in Million) | 2025 | 2024 | 2023 | 2022 | 2021 |
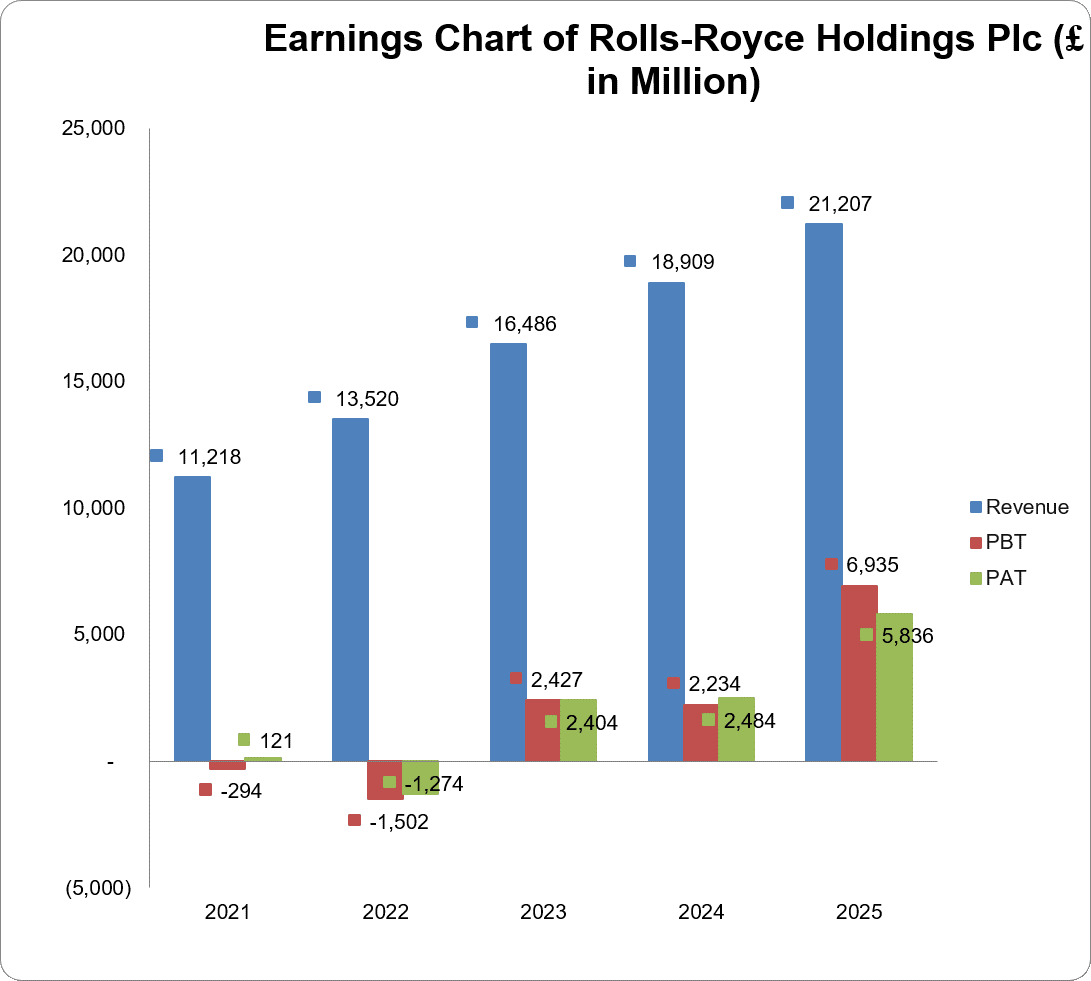
| Turnover | 21,207 | 18,909 | 16,486 | 13,520 | 11,218 |
| Year-on-Year Change | 12.2% | 14.7% | 21.9% | 20.5% | -2.4% |
| Operating Profit | 4,468 | 2,906 | 1,944 | 837 | 513 |
| Year-on-Year Change | 53.8% | 49.5% | 132.3% | 63.2% | -126.0% |
| EBITDA | 5,370 | 3,793 | 2,892 | 1,789 | 1,505 |
| Year-on-Year Change | 41.6% | 31.2% | 61.7% | 18.9% | -284.9% |
| PBT | 6,935 | 2,234 | 2,427 | -1,502 | -294 |
| Year-on-Year Change | 210.4% | -8.0% | -261.6% | 410.9% | -89.5% |
| PAT | 5,836 | 2,484 | 2,404 | -1,274 | 121 |
| Year-on-Year Change | 134.9% | 3.3% | -288.7% | -1,152.9% | -103.8% |
| Total Assets | 38,115 | 35,686 | 31,512 | 29,450 | 28,674 |
| Year-on-Year Change | 6.8% | 13.3% | 7.0% | 2.7% | -2.9% |
| Net Current Assets | 3,885 | 4,710 | 3,185 | 2,093 | 2,128 |
| Year-on-Year Change | -17.5% | 47.9% | 52.2% | -1.6% | 237.2% |
| Total Equity | 2,753 | -881 | -3,629 | -6,016 | -4,636 |
| Year-on-Year Change | -412.5% | -75.7% | -39.7% | 29.8% | -4.9% |
| Capital Expenditure | 985 | 886 | 713 | 596 | 559 |
| Year-on-Year Change | 11.2% | 24.3% | 19.6% | 6.6% | -41.2% |
| Funds from Operations | 4,565 | 3,782 | 2,485 | 1,524 | -259 |
| Year-on-Year Change | 20.7% | 52.2% | 63.1% | -688.4% | -91.4% |
| Free Operating Cashflow | 3,580 | 2,896 | 1,772 | 928 | -818 |
| Year-on-Year Change | 23.6% | 63.4% | 91.0% | -213.5% | -79.3% |
| Total Debt | 4,272 | 5,132 | 5,759 | 5,955 | 7,776 |
| Year-on-Year Change | -16.8% | -10.9% | -3.3% | -23.4% | 6.1% |
| Net Debt | -1,972 | -443 | 1,975 | 3,348 | 5,155 |
| Year-on-Year Change | 345.2% | -122.4% | -41.0% | -35.1% | 32.9% |
| Shares Outstanding-ordinary shares (Million) | 8,415 | 8,388 | 8,361 | 8,349 | 8,368 |
| Year-on-Year Change | 0.3% | 0.3% | 0.1% | -0.2% | 0.0% |
| Payout Ratio | 13.7% | 20.3% | 0.0% | 0.0% | 0.0% |
| ⇑ – Year-on-Year Increase | Green: ‘Improved’ |
| ⇓ – Year-on-Year Decrease | Red: ‘Worsened’ |
| ⇔ – Year-on-Year Unchanged |
| 2025 | 2024 | 2023 | 2022 | 2021 | |
| CAPITAL STRUCTURE | |||||
| Total Debt/(Total Debt + Equity) | 60.8%⇓ | 120.7%⇓ | 270.4%⇑ | -9,762.3%⇓ | 247.6%⇓ |
| Net Debt/Equity | -71.6%⇓ | 50.3%⇑ | -54.4%⇑ | -55.7%⇑ | -111.2%⇓ |
| Debt/Total Assets | 11.2%⇓ | 14.4%⇓ | 18.3%⇓ | 20.2%⇓ | 27.1%⇑ |
| Long Term Debt/Net Earnings | 0.5x⇓ | 1.6x⇓ | 2.2x⇑ | -7.4x⇓ | 46.3x⇑ |
| Current Ratio | 1.2x⇓ | 1.3x⇑ | 1.2x⇔ | 1.2x⇔ | 1.2x⇑ |
| Acid Test Ratio | 0.9x⇓ | 1.0x⇑ | 0.9x⇑ | 0.8x⇓ | 0.9x⇓ |
| CASHFLOW RATIOS | |||||
| Funds from Operations/Total Debt | 1.1x⇑ | 0.7x⇑ | 0.4x⇑ | 0.3x⇑ | 0.0x⇑ |
| Funds from Operations/Net Debt | -2.3x⇓ | -8.5x⇓ | 1.3x⇑ | 0.5x⇑ | -0.1x⇑ |
| EBITDA/Interest | 11.2x⇑ | 3.1x⇓ | 4.3x⇑ | 0.6x⇓ | 1.4x⇑ |
| EBIT/Interest | 9.3x⇑ | 2.4x⇓ | 2.9x⇑ | 0.3x⇓ | 0.5x⇑ |
| Net Debt/EBITDA | -0.4x⇓ | -0.1x⇓ | 0.7x⇓ | 1.9x⇓ | 3.4x⇑ |
| Free Operating Cashflow/Interest | 7.5x⇑ | 2.4x⇓ | 2.6x⇑ | 0.3x⇑ | -0.8x⇑ |
| Free Operating Cashflow/Net Debt | -1.8x⇑ | -6.5x⇓ | 0.9x⇑ | 0.3x⇑ | -0.2x⇑ |
| Free Operating Cashflow/Sales | 0.2x⇔ | 0.2x⇑ | 0.1x⇔ | 0.1x⇑ | -0.1x⇑ |
| PROFITABILITY RATIOS | |||||
| Gross Profit Margin | 29.1%⇑ | 22.3%⇑ | 22.0%⇑ | 20.4%⇑ | 19.0%⇑ |
| EBITDA Margin | 25.3%⇑ | 20.1%⇑ | 17.5%⇑ | 13.2%⇓ | 13.4%⇑ |
| EBIT Margin | 21.1%⇑ | 15.4%⇑ | 11.8%⇑ | 6.2%⇑ | 4.6%⇑ |
| PBT Margin | 32.7%⇑ | 11.8%⇓ | 14.7%⇑ | -11.1%⇓ | -2.6%⇑ |
| PAT Margin | 27.5%⇑ | 13.1%⇓ | 14.6%⇑ | -9.4%⇓ | 1.1%⇑ |
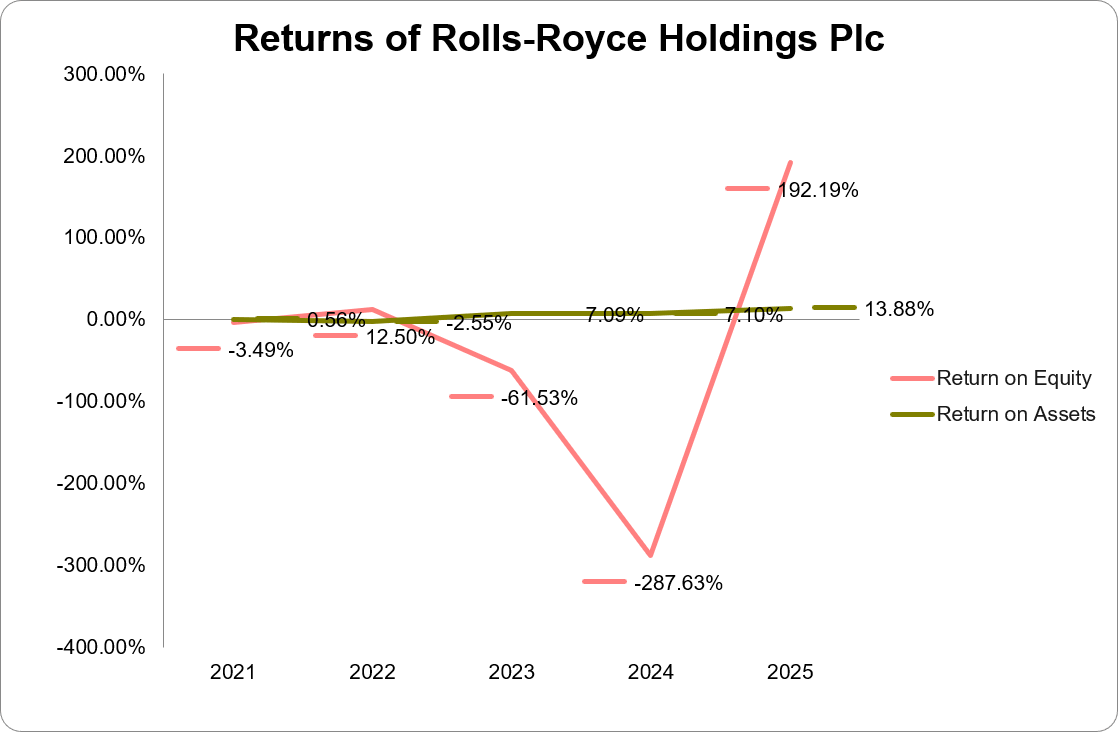
| ROAE | 565.3%⇑ | -112.4%⇓ | -46.3%⇓ | 14.1%⇑ | -3.4%⇓ |
| ROAA | 14.3%⇑ | 7.5%⇑ | 7.3%⇑ | -2.6%⇓ | 0.6%⇑ |