| (£ in Million) | 2025 | 2024 | 2023 | 2022 | 2021 |
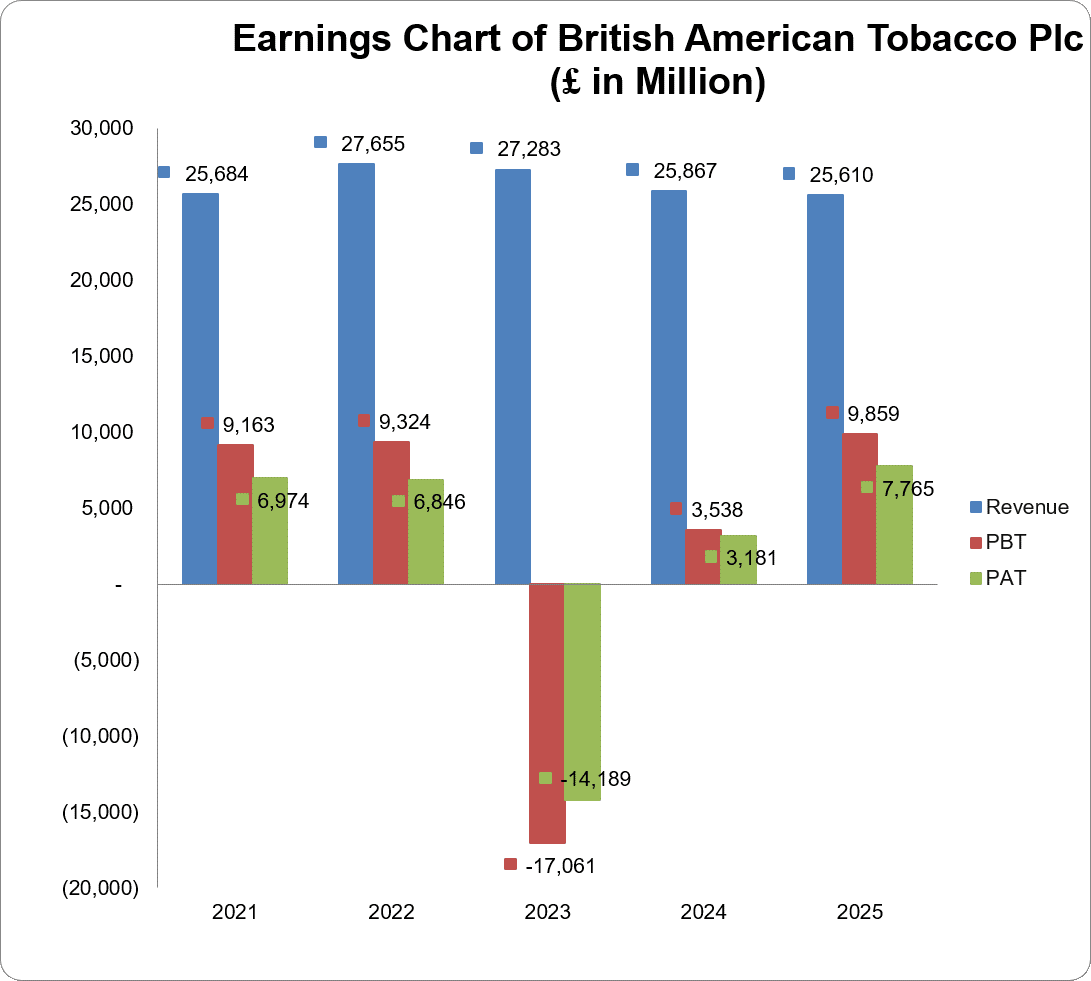
| Turnover | 25,610 | 25,867 | 27,283 | 27,655 | 25,684 |
| Year-on-Year Change | -1.0% | -5.2% | -1.4% | 7.7% | -0.4% |
| Operating Profit | 9,997 | 2,736 | -15,751 | 10,523 | 10,234 |
| Year-on-Year Change | 265.4% | -117.4% | -249.7% | 2.8% | 2.7% |
| EBITDA | 12,544 | 5,837 | 12,863 | 11,828 | 11,310 |
| Year-on-Year Change | 114.9% | -54.6% | 8.8% | 4.6% | -0.9% |
| PBT | 9,859 | 3,538 | -17,061 | 9,324 | 9,163 |
| Year-on-Year Change | 178.7% | -120.7%^ | -283.0% | 1.8% | 5.7% |
| PAT | 7,765 | 3,181 | -14,189 | 6,846 | 6,974 |
| Year-on-Year Change | 144.1% | -122.4% | -307.3% | -1.8% | 6.3% |
| Total Assets | 109,290 | 118,899 | 118,716 | 153,546 | 137,365 |
| Year-on-Year Change | -8.1% | 0.2% | -22.7% | 11.8% | -0.2% |
| Total Equity | 48,145 | 49,995 | 52,934 | 75,710 | 67,401 |
| Year-on-Year Change | -3.7% | -5.6% | -30.1% | 12.3% | 7.1% |
| Capital Expenditure | 704 | 608 | 601 | 656 | 745 |
| Year-on-Year Change | 15.8% | 1.2% | -8.4% | -12.0% | -1.3% |
| Funds from Operations | 6,342 | 10,125 | 10,714 | 10,394 | 9,717 |
| Year-on-Year Change | -37.4% | -5.5% | 3.1% | 7.0% | -0.7% |
| Free Operating Cashflow | 5,638 | 9,517 | 10,113 | 9,738 | 8,972 |
| Year-on-Year Change | -40.8% | -5.9% | 3.9% | 8.5% | -0.7% |
| Total Debt | 35,070 | 36,950 | 39,730 | 43,139 | 39,658 |
| Year-on-Year Change | -5.1% | -7.0% | -7.9% | 8.8% | -9.8% |
| Net Debt | 31,243 | 31,653 | 35,071 | 39,693 | 36,849 |
| Year-on-Year Change | -1.3% | -9.8% | -11.6% | 7.7% | -9.8% |
| Shares Outstanding (Million) | 2,187.0 | 2,214.0 | 2,229.0 | 2,256.0 | 2,287.0 |
| Year-on-Year Change | -1.2% | -0.7% | -1.2% | -1.4% | 0.0% |
| Payout Ratio | 67.7% | 163.9% | -36.3% | 71.8% | 70.7% |
| ⇑ – Year-on-Year Increase | Green: ‘Improved’ |
| ⇓ – Year-on-Year Decrease | Red: ‘Worsened’ |
| ⇔ – Year-on-Year Unchanged |
| 2025 | 2024 | 2023 | 2022 | 2021 | |
| CAPITAL STRUCTURE | |||||
| Total Debt/(Total Debt + Equity) | 42.1%⇓ | 42.5%⇓ | 42.9%⇑ | 36.3%⇓ | 37.0%⇓ |
| Net Debt/Equity | 64.9%⇑ | 63.3%⇓ | 66.3%⇑ | 52.4%⇓ | 54.7%⇓ |
| Debt/Total Assets | 32.1%⇑ | 31.1%⇓ | 33.5%⇑ | 28.1%⇓ | 28.9%⇓ |
| Long Term Debt/Net Earnings | 7.2x⇓ | 10.8x⇑ | -2.0x⇓ | 2.5x⇓ | 4.7x⇓ |
| Current Ratio | 0.9x⇑ | 0.8x⇓ | 0.9x⇔ | 0.9x⇔ | 0.9x⇓ |
| Acid Test Ratio | 0.6x⇑ | 0.5x⇓ | 0.6x⇔ | 0.6x⇑ | 0.5x⇓ |
| CASHFLOW RATIOS | |||||
| Funds from Operations/Total Debt | 0.2x⇓ | 0.3x⇔ | 0.3x⇑ | 0.2x⇓ | 0.3x⇑ |
| Funds from Operations/Net Debt | 0.2x⇓ | 0.3x⇔ | 0.3x⇔ | 0.3x⇔ | 0.3x⇑ |
| EBITDA/Interest | 6.2x⇑ | 4.3x⇓ | 6.2x⇓ | 6.8x⇓ | 7.4x⇑ |
| EBIT/Interest | 4.9x⇑ | 2.0x⇑ | -7.6x⇓ | 6.1x⇓ | 6.7x⇑ |
| Net Debt/EBITDA | 2.5x⇓ | 5.4x⇑ | 2.7x⇓ | 3.4x⇑ | 3.3x⇓ |
| Free Operating Cashflow/Interest | 2.8x⇓ | 7.1x⇑ | 4.9x⇓ | 5.6x⇓ | 5.9x⇑ |
| Free Operating Cashflow/Net Debt | 0.2x⇓ | 0.3x⇔ | 0.3x⇔ | 0.3x⇑ | 0.2x⇔ |
| Free Operating Cashflow/Sales | 0.2x⇓ | 0.4x⇔ | 0.4x⇔ | 0.4x⇔ | 0.4x⇔ |
| PROFITABILITY RATIOS | |||||
| EBITDA Margin | 49.0%⇑ | 22.6%⇓ | 47.2%⇑ | 42.8%⇓ | 44.0%⇓ |
| EBIT Margin | 39.0%⇑ | 10.6%⇑ | -57.7%⇓ | 38.1%⇓ | 39.9%⇑ |
| PBT Margin | 38.5%⇑ | 13.7%⇑ | -62.5%⇓ | 33.7%⇓ | 35.7%⇑ |
| PAT Margin | 30.3%⇑ | 12.3%⇑ | -52.0%⇓ | 24.8%⇓ | 27.2%⇑ |
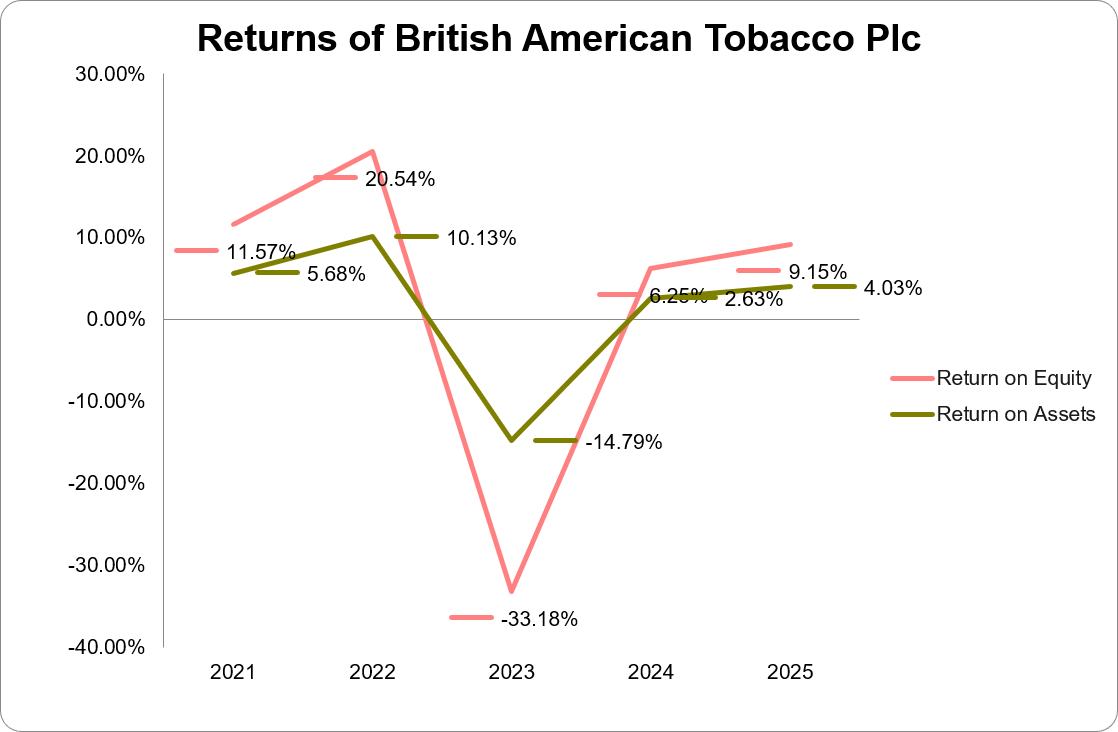
| ROAE | 9.0%⇑ | 6.1%⇑ | -27.3%⇓ | 21.7%⇑ | 12.0%⇑ |
| ROAA | 3.9%⇑ | 2.6%⇑ | -12.9%⇓ | 10.7%⇑ | 5.7%⇑ |