| (US$ in Million) | 2025 | 2024 | 2023 | 2022 | 2021 |
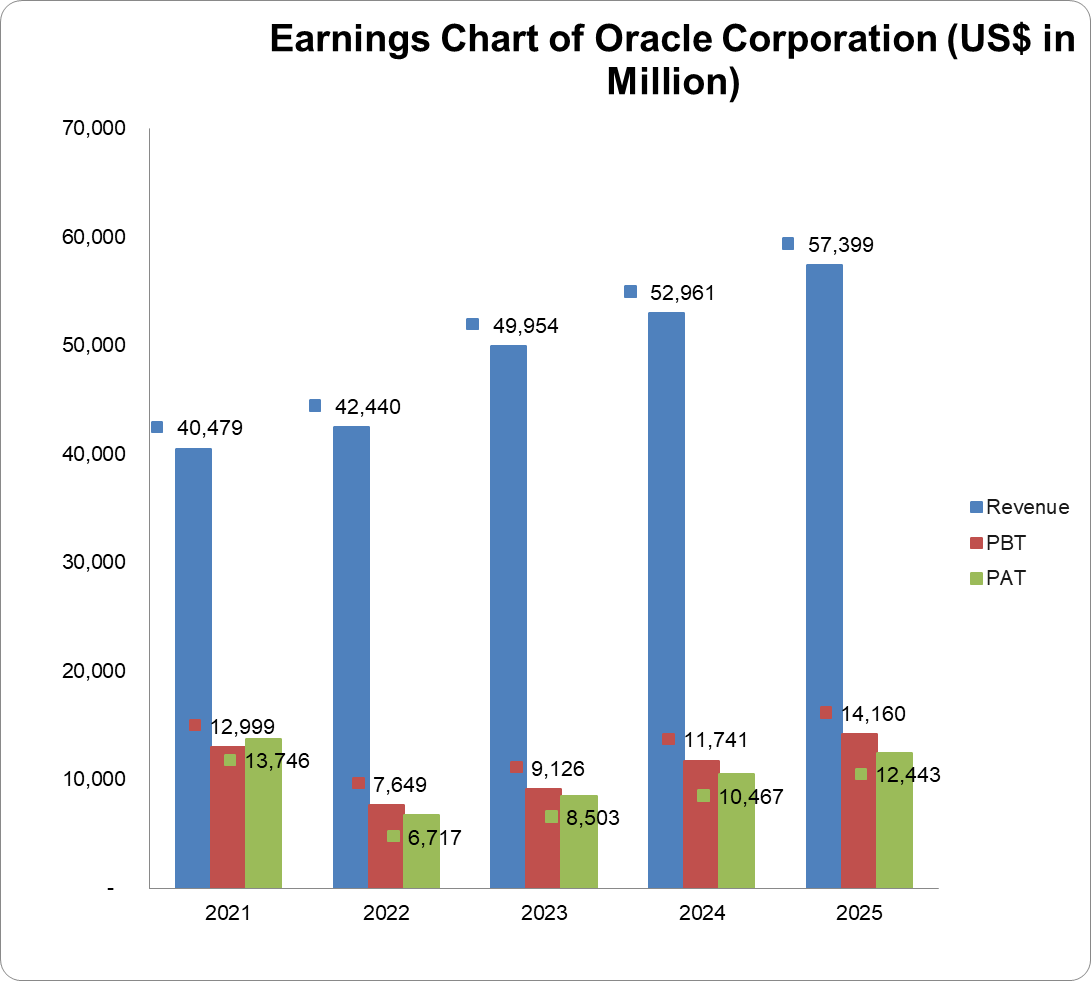
| Turnover | 57,399 | 52,961 | 49,954 | 42,440 | 40,479 |
| Year-on-Year Change | 8.4% | 6.0% | 17.7% | 4.8% | 3.6% |
| Operating Profit | 17,678 | 15,353 | 13,093 | 10,926 | 15,213 |
| Year-on-Year Change | 15.1% | 17.3% | 19.8% | -28.1% | 9.5% |
| EBITDA | 23,852 | 21,492 | 19,201 | 14,048 | 18,129 |
| Year-on-Year Change | 11.0% | 11.9% | 36.7% | -22.5% | 7.5% |
| PBT | 14,160 | 11,741 | 9,126 | 7,649 | 12,999 |
| Year-on-Year Change | 20.6% | 28.7% | 19.3% | -41.2% | 7.8% |
| PAT | 12,443 | 10,467 | 8,503 | 6,717 | 13,746 |
| Year-on-Year Change | 18.9% | 23.1% | 26.6% | -51.1% | 35.6% |
| Total Assets | 168,361 | 140,976 | 134,384 | 109,297 | 131,107 |
| Year-on-Year Change | 19.4% | 4.9% | 23.0% | -16.6% | 13.6% |
| Net Current Assets | -8,064 | -8,990 | -2,086 | 12,122 | 31,403 |
| Year-on-Year Change | -10.3% | 331.0% | -117.2% | -61.4% | -10.1% |
| Total Equity | 20,969 | 9,239 | 1,556 | -5,768 | 5,952 |
| Year-on-Year Change | 127.0% | 493.8% | -127.0% | -196.9% | -53.2% |
| Capital Expenditure | 21,215 | 6,929 | 36,416 | 4,659 | 2,176 |
| Year-on-Year Change | 206.2% | -81.0% | 681.6% | 114.1% | 28.9% |
| Funds from Operations | 20,821 | 18,673 | 17,165 | 9,539 | 15,887 |
| Year-on-Year Change | 11.5% | 8.8% | 80.0% | -40.0% | 20.9% |
| Free Operating Cashflow | -394 | 11,744 | -19,251 | 4,880 | 13,711 |
| Year-on-Year Change | -103.4% | -161.0% | -494.5% | -64.4% | 19.7% |
| Total Debt | 104,104 | 93,124 | 90,481 | 75,859 | 84,245 |
| Year-on-Year Change | 11.8% | 2.9% | 19.3% | -10.0% | 17.7% |
| Net Debt | 93,318 | 82,670 | 80,716 | 54,476 | 54,147 |
| Year-on-Year Change | 12.9% | 2.4% | 48.2% | 0.6% | 57.6% |
| Shares Outstanding (Million) | 2,789 | 2,744 | 2,696 | 2,700 | 2,945 |
| Year-on-Year Change | 1.6% | 1.8% | -0.2% | -8.3% | -8.3% |
| Payout Ratio | 37.3% | 41.6% | 42.3% | 55.7% | 21.4% |
| ⇑ – Year-on-Year Increase | Green: ‘Improved’ |
| ⇓ – Year-on-Year Decrease | Red: ‘Worsened’ |
| ⇔ – Year-on-Year Unchanged |
| 2025 | 2024 | 2023 | 2022 | 2021 | |
| CAPITAL STRUCTURE | |||||
| Total Debt/(Total Debt + Equity) | 83.2%⇓ | 91.0%⇓ | 98.3%⇓ | 108.2%⇑ | 93.4%⇑ |
| Net Debt/Equity | 445.0%⇓ | 894.8%⇓ | 5,187.4%⇑ | -944.5%⇓ | 909.7%⇑ |
| Debt/Total Assets | 61.8%⇓ | 66.1%⇓ | 67.3%⇓ | 69.4%⇑ | 64.3%⇑ |
| Long Term Debt/Net Earnings | 7.6x⇓ | 7.8x⇓ | 10.0x⇓ | 11.6x⇑ | 5.3x⇓ |
| Current Ratio | 0.8x⇑ | 0.7x⇓ | 0.9x⇓ | 1.6x⇓ | 2.3x⇓ |
| Acid Test Ratio | 0.8x⇑ | 0.7x⇓ | 0.9x⇓ | 1.6x⇓ | 2.3x⇓ |
| CASHFLOW RATIOS | |||||
| Funds from Operations/Total Debt | 0.2x⇔ | 0.2x⇔ | 0.2x⇑ | 0.1x⇓ | 0.2x⇔ |
| Funds from Operations/Net Debt | 0.2x⇔ | 0.2x⇔ | 0.2x⇔ | 0.2x⇓ | 0.3x⇓ |
| EBITDA/Interest | 6.7x⇑ | 6.1x⇑ | 5.5x⇑ | 5.1x⇓ | 7.3x⇓ |
| EBIT/Interest | 4.9x⇑ | 4.4x⇑ | 3.7x⇓ | 4.0x⇓ | 6.1x⇓ |
| Net Debt/EBITDA | 3.9x⇔ | 3.9x⇓ | 4.2x⇑ | 3.9x⇑ | 3.0x⇑ |
| Free Operating Cashflow/Interest | -0.1x⇓ | 3.3x⇑ | -5.5x⇓ | 1.8x⇓ | 5.5x⇓ |
| Free Operating Cashflow/Net Debt | 0.0x⇓ | 0.1x⇑ | -0.2x⇓ | 0.1x⇓ | 0.3x⇔ |
| Free Operating Cashflow/Sales | 0.0x⇓ | 0.2x⇑ | -0.4x⇓ | 0.1x⇓ | 0.3x⇔ |
| PROFITABILITY RATIOS | |||||
| EBITDA Margin | 41.6%⇑ | 40.6%⇑ | 38.4%⇑ | 33.1%⇓ | 44.8%⇑ |
| EBIT Margin | 30.8%⇑ | 29.0%⇑ | 26.2%⇑ | 25.7%⇓ | 37.6%⇑ |
| PBT Margin | 24.7%⇑ | 22.2%⇑ | 18.3%⇑ | 18.0%⇓ | 32.1%⇑ |
| PAT Margin | 21.7%⇑ | 19.8%⇑ | 17.0%⇑ | 15.8%⇓ | 34.0%⇑ |
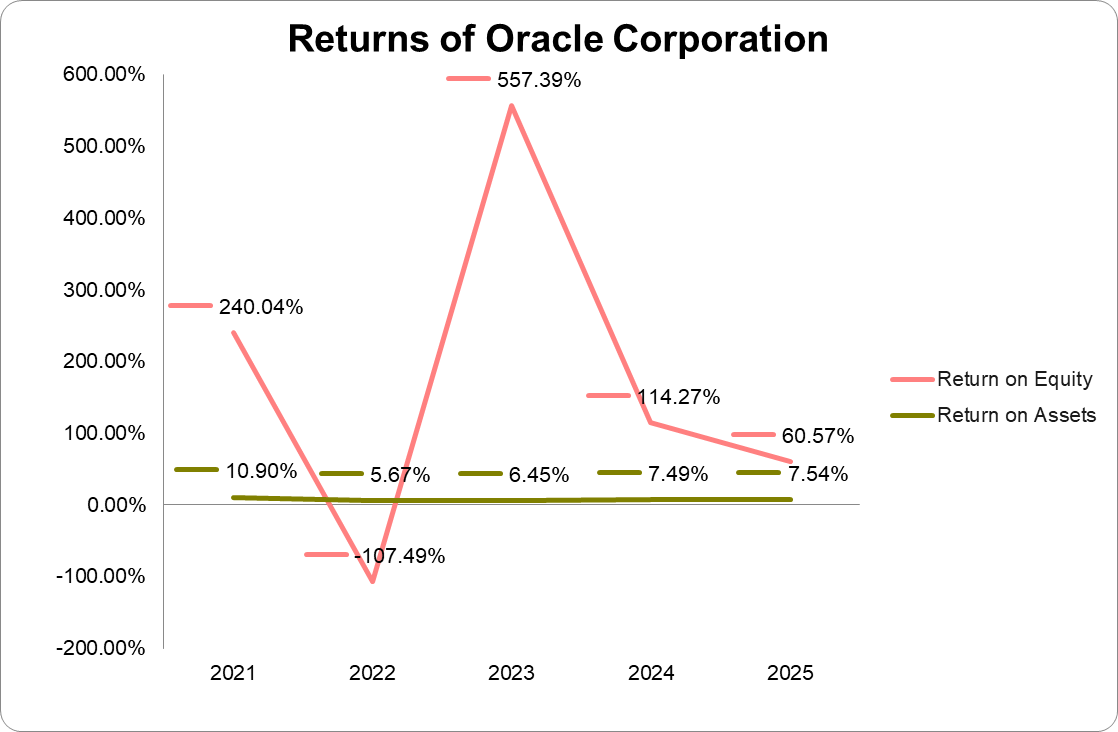
| ROAE | 84.1%⇓ | 195.6%⇑ | -411.8%⇓ | 6,739.1%⇑ | 153.1%⇓ |
| ROAA | 8.2%⇑ | 7.7%⇑ | 7.1%⇑ | 5.2%⇓ | 11.6%⇓ |