| (Yen in Million) | 2024 | 2023 | 2022 | 2021 | 2020 |
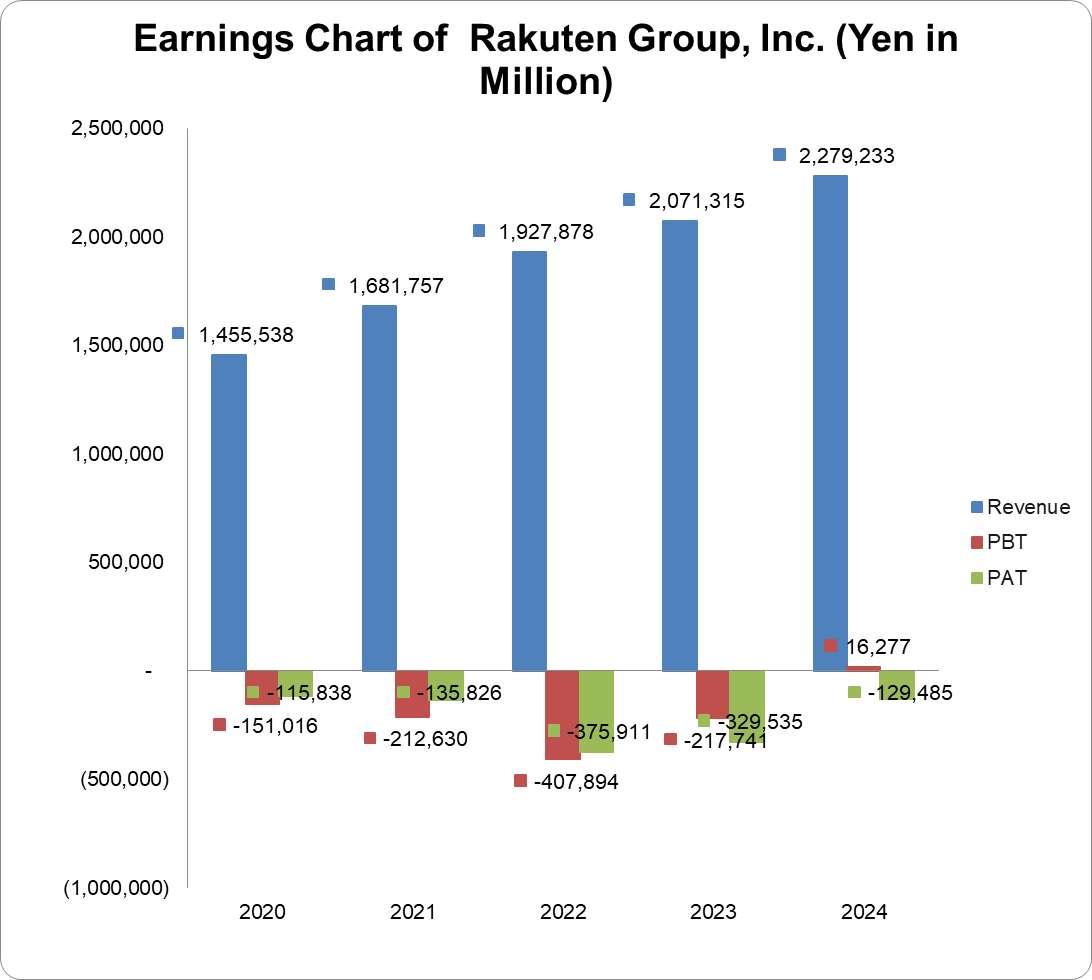
| Turnover | 2,279,233 | 2,071,315 | 1,927,878 | 1,681,757 | 1,455,538 |
| Year-on-Year Change | 10.0% | 7.4% | 14.6% | 15.5% | 15.2% |
| Operating Profit | -24,573 | -163,644 | -326,240 | -284,662 | -124,092 |
| Year-on-Year Change | -85.0% | -49.8% | 14.6% | 129.4% | 4,078.2% |
| EBITDA | 291,862 | 136,127 | -60,122 | -87,309 | 27,414 |
| Year-on-Year Change | 114.4% | -326.4% | -31.1% | -418.5% | -73.5% |
| PBT | 16,277 | -217,741 | -407,894 | -212,630 | -151,016 |
| Year-on-Year Change | -107.5% | -46.6% | 91.8% | 40.8% | 238.9% |
| PAT | -129,485 | -329,535 | -375,911 | -135,826 | -115,838 |
| Year-on-Year Change | -60.7% | -12.3% | 176.8% | 17.3% | 250.3% |
| Total Assets | 26,514,728 | 22,625,576 | 20,437,298 | 16,831,221 | 12,524,438 |
| Year-on-Year Change | 17.2% | 10.7% | 21.4% | 34.4% | 36.6% |
| Total Equity | 1,238,514 | 1,087,723 | 871,090 | 1,117,290 | 629,014 |
| Year-on-Year Change | 13.9% | 24.9% | -22.0% | 77.6% | -14.7% |
| Capital Expenditure | 243,237 | 351,157 | 439,413 | 410,641 | 385,074 |
| Year-on-Year Change | -30.7% | -20.1% | 7.0% | 6.6% | 85.8% |
| Funds from Operations | 1,190,882 | 724,192 | -257,947 | 582,707 | 1,041,391 |
| Year-on-Year Change | 64.4% | -380.8% | -144.3% | -44.1% | 227.2% |
| Free Operating Cashflow | 947,645 | 373,035 | -697,360 | 172,066 | 656,317 |
| Year-on-Year Change | 154.0% | -153.5% | -505.3% | -73.8% | 490.8% |
| Total Debt | 5,461,713 | 4,795,173 | 4,912,750 | 3,402,912 | 2,487,457 |
| Year-on-Year Change | 13.9% | -2.4% | 44.4% | 36.8% | 44.0% |
| Net Debt | -709,175 | -332,501 | 218,390 | -1,007,389 | -533,849 |
| Year-on-Year Change | 113.3% | -252.3% | -121.7% | 88.7% | -314.8% |
| Shares Outstanding (Million) | 2,148 | 1,915 | 1,587 | 1,527 | 1,359 |
| Year-on-Year Change | 12.2% | 20.7% | 3.9% | 12.4% | 0.4% |
| Payout Ratio | 0.0% | 0.0% | -2.3% | -9.4% | -4.6% |
| ⇑ – Year-on-Year Increase | Green: ‘Improved’ |
| ⇓ – Year-on-Year Decrease | Red: ‘Worsened’ |
| ⇔ – Year-on-Year Unchanged |
| 2024 | 2023 | 2022 | 2021 | 2020 | |
| CAPITAL STRUCTURE | |||||
| Total Debt/(Total Debt + Equity) | 81.5%⇔ | 81.5%⇓ | 84.9%⇑ | 75.3%⇓ | 79.8%⇑ |
| Net Debt/Equity | -57.3%⇓ | -30.6%⇓ | 25.1%⇑ | -90.2%⇓ | -84.9%⇓ |
| Debt/Total Assets | 20.6%⇓ | 21.2%⇓ | 24.0%⇑ | 20.2%⇑ | 19.9%⇑ |
| CASHFLOW RATIOS | |||||
| Funds from Operations/Total Debt | 0.2x⇔ | 0.2x⇑ | -0.1x⇓ | 0.2x⇓ | 0.4x⇑ |
| Funds from Operations/Net Debt | -1.7x⇑ | -2.2x⇓ | -1.2x⇓ | -0.6x⇑ | -2.0x⇓ |
| EBITDA/Interest | 2.7x⇑ | 2.1x⇑ | -0.4x⇑ | -2.3x⇓ | 0.3x⇓ |
| EBIT/Interest | -0.2x⇑ | -2.5x⇓ | -2.1x⇑ | -7.4x⇓ | -1.6x⇓ |
| Net Debt/EBITDA | -2.4x⇔ | -2.4x⇑ | -3.6x⇓ | 11.5x⇑ | -19.5x⇓ |
| Free Operating Cashflow/Interest | 8.6x⇑ | 5.8x⇑ | -4.5x⇓ | 4.5x⇓ | 8.2x⇓ |
| Free Operating Cashflow/Net Debt | -1.3x⇓ | -1.1x⇑ | -3.2x⇓ | -0.2x⇑ | -1.2x⇓ |
| Free Operating Cashflow/Sales | 0.4x⇑ | 0.2x⇑ | -0.4x⇓ | 0.1x⇓ | 0.5x⇑ |
| PROFITABILITY RATIOS | |||||
| Gross Profit Margin | 69.2%⇑ | 67.5%⇑ | 62.8%⇑ | 60.2%⇓ | 63.5%⇓ |
| EBITDA Margin | 12.8%⇑ | 6.6%⇑ | -3.1%⇑ | -5.2%⇓ | 1.9%⇓ |
| EBIT Margin | -1.1%⇑ | -7.9%⇑ | -16.9%⇔ | -16.9%⇓ | -8.5%⇓ |
| PBT Margin | 0.7%⇑ | -10.5%⇑ | -21.2%⇓ | -12.6%⇓ | -10.4%⇓ |
| PAT Margin | -5.7%⇑ | -15.9%⇑ | -19.5%⇓ | -8.1%⇓ | -8.0%⇓ |
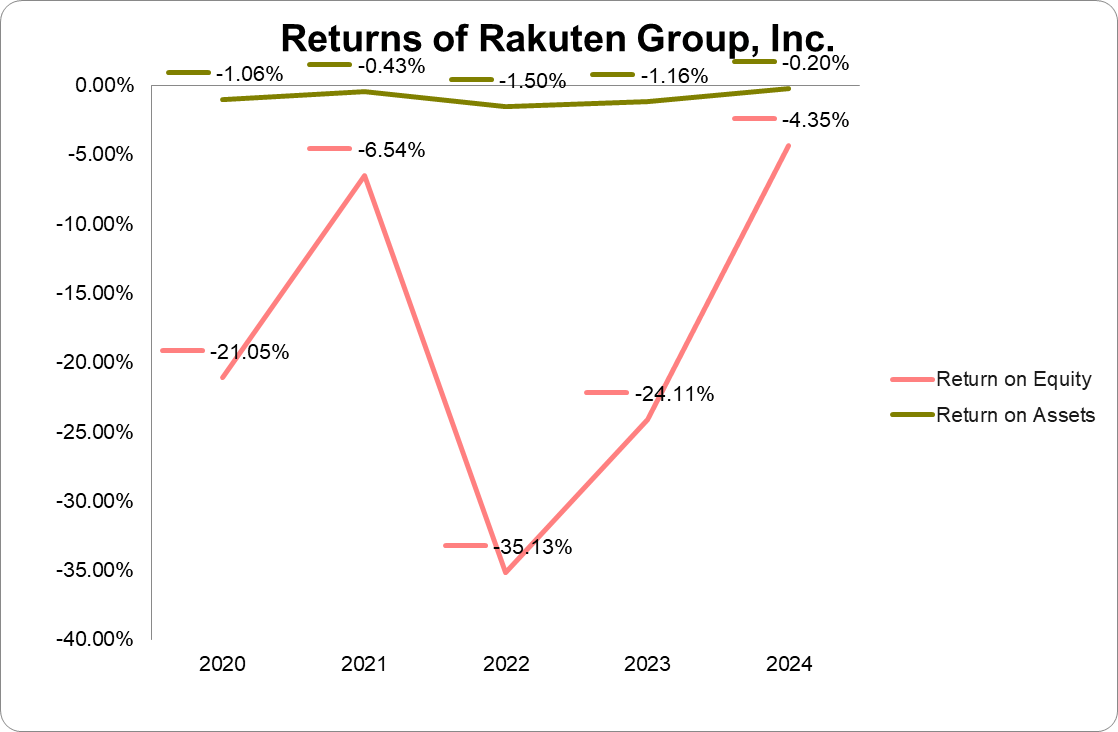
| ROAE | -4.6%⇑ | -26.8%⇑ | -30.8%⇓ | -8.4%⇑ | -19.4%⇓ |
| ROAA | -0.2%⇑ | -1.2%⇑ | -1.6%⇓ | -0.5%⇑ | -1.2%⇓ |