| Ticker: SPCX | Nature of Business: Aerospace | Location: USA |
| Recent Price: $160.95 | 52-Week High/Low: $176.52/149.34 | Estimated Fair Value:$35.63 – $53.00 |
| Expected Return: 27.5% | Consider Buy: Below $53.00 | Business Risk: High |
| Financial Risk: Medium | Economic Moat: Weak | Corporate Governance: Strong |
Company Overview
Space Exploration Technologies Corp. (SPACEX), an American space technology company, was established in 2002. The company provides space travel services, high-speed internet connectivity, and Artificial Intelligence (AI) solutions. The company acquired xAI in 2026. xAI includes Grok and X (formerly Twitter). The shares of SPACEX were listed on NASDAQ in June 2026.
Research and Development (R&D) and AI are at the centre of the company’s efforts to advance space research and make life interplanetary. Capital expenditure totalled $36.3 billion between 2023 and 2025, with the AI business segment accounting for $18.8 billion or 51.8% of the company’s total capital expenditure. R&D expense was $14.2 billion in the same period, with the AI segment responsible for $6.4 billion or 45.2% of the total. Following the acquisition of xAI, SPACEX is harnessing its competence in satellite and rocket manufacturing to deploy AI compute satellites in space. The company plans to start deploying orbital AI compute satellites in 2028. Orbital data centres in space will be more energy-efficient and robust than terrestrial data centres.
The company has an 8-member board of directors that is chaired by the founder, Elon Musk. Musk is also the Chief Executive Officer and Chief Technical Officer of the company. Gwynne Shotwell doubles as the President and Chief Operating Officer of SPACEX.
Investment Thesis
SPACEX is an integrated company that produces both the software and hardware infrastructure for space travel, internet connectivity and AI. It makes its spacecraft, rockets and the AI computing infrastructure. This has enabled the company to achieve cost savings and efficiency. It operates three business segments, namely space, connectivity and AI.
SPACEX is a leading company in space exploration and interplanetary missions. The company accounts for 80% of global payloads transported into space. Its reusable spacecraft have significantly lowered the cost of space flights. The company has completed over 650 missions, with over 85% of missions flown with reused launch vehicles. The cost of sales to revenue ratio for the company’s space business segment has been declining. The cost of sales to turnover ratio dropped from 46.9% in 2023 to 33.1% in 2025. This is why it is the business segment that has produced the highest gross profit margin. Its gross profit margin averaged 59.8% over the past three years compared to the connectivity segment with 37.8% and AI segment with 37.2%. The gross profit margin for the whole business averaged out to 44.5%.
The company also provides mobile and broadband connectivity through over 9000 low-earth orbit satellites to over 10 million customers in over 160 countries. We expect the growing demand for high-speed and reliable internet connection to continue to boost demand from individuals, businesses and governments. The revenue from the connectivity segment grew at a compound rate of 71.6% in the past two years. In 2025, consumers produced a connectivity revenue of $7.2 billion as against $4.2 billion from enterprises and governments.
Revenue is growing in all its markets. The revenue from outside the USA jumped by 42.5% to $5.7 billion in 2025 compared to the previous year’s revenue of $4 billion. In the USA, revenue swelled by 29.6% year-on-year.
SPACEX requires additional capital to prevent the total equity from being wiped out due to huge losses it has been incurring. This is more important now that the company is ramping up its spending on AI infrastructure. Relying too much on debt does not bode well for the company. The debt-to-equity ratio in 2025 was 889.9%; the company hardly makes any operating profit to cover its interest expense. However, it has been producing a positive operating cash flow, which is enough to cover its debt obligations. Operating cash flow in 2025 was $6.8 billion (2024: $5.8 billion). Operating cash flow covered interest payments 3.5 times in 2025 and 3.7 times in the prior year, 2024. Also, debt was 24.9% of total assets (2024: 24.2%).
The business is capital-intensive with capital expenditure skyrocketing, reaching $20.7 billion; the AI segment was responsible for $12.7 billion or 61.4% of total capital spending (2024: $5.6 billion or 50.5% of total capital expenditure). We expect R&D and capital expenditure to continue to rise as the company increases its terrestrial AI compute infrastructure and orbital data centres.
We are of the opinion that the company’s investment in AI data centres would pay off in the medium term. In addition, SPACEX is a leader in space launch services with its advanced rockets and spacecraft. Considering its fundamentals, however, the company’s shares are grossly overvalued. We will keep tabs on the company to see how things pan out.
Valuation
A share of SPACEX should trade between $35.63 and $53.00 based on our valuation. Currently, the market price is above our fair value estimate. Therefore, the company’s shares are trading at a premium to their intrinsic value.
Financial Overview
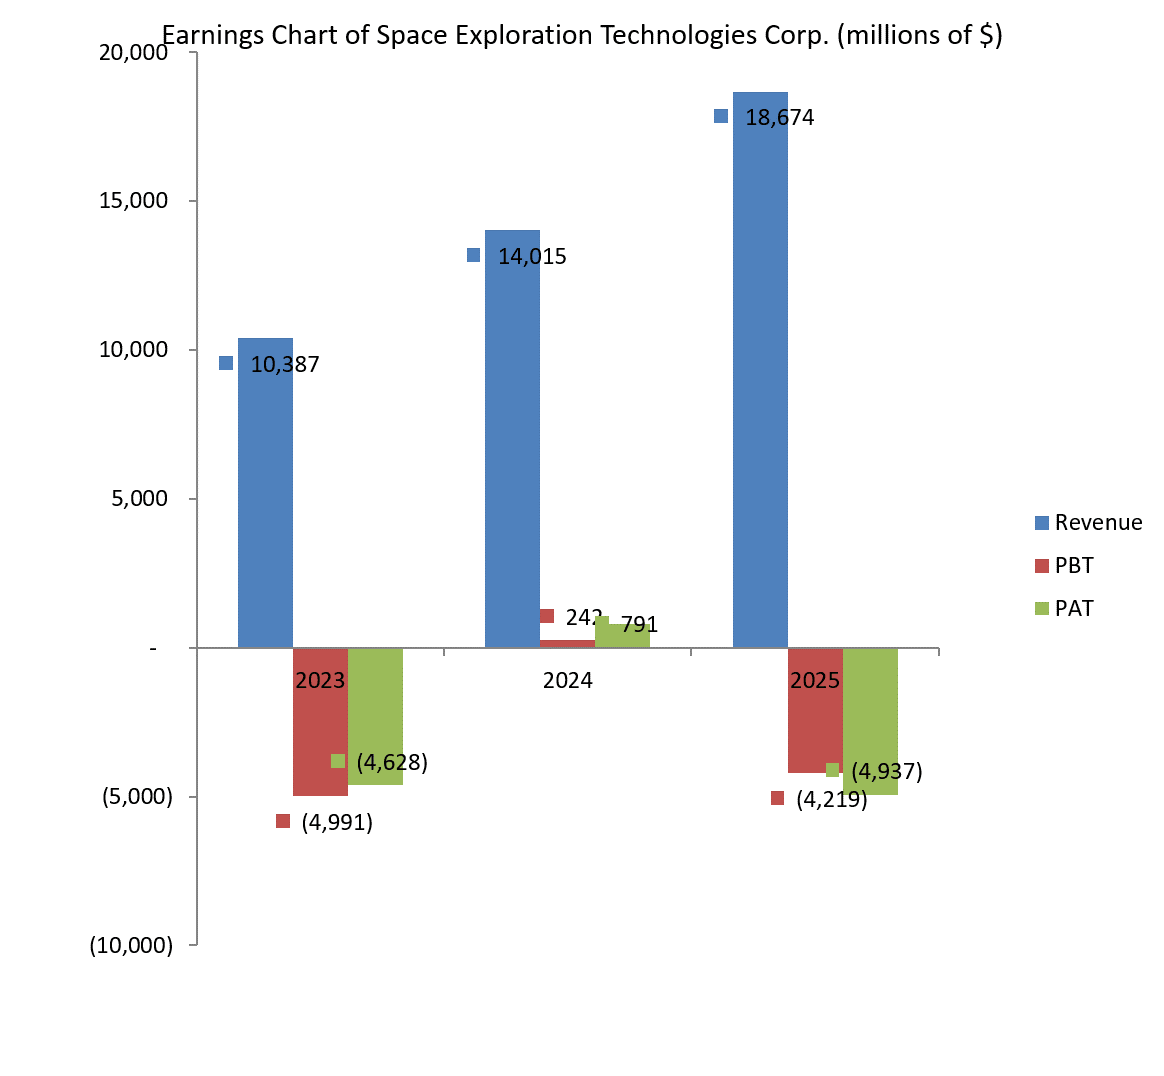
SPACEX posted a revenue of $18.7 billion in 2025 compared to $14 billion in the previous year. This was tantamount to a year-on-year revenue growth of 33.2%. The USA accounts for most of the company’s revenue, generating $13 billion or 69.4% of total revenue (2024: $10 billion or 71.4% of total revenue). The other important markets for the company’s products are Ireland and Canada which together produced 13.9% of total revenue in both 2024 and 2025.
The contribution of the connectivity business segment to the company’s earnings is on the rise due to the increasing demand for its satellite internet services. The connectivity unit was responsible for 61% of total revenue in 2025 as against 54.2% in 2024. Connectivity revenue almost tripled in two years, rising to $11.4 billion in 2025 from $3.9 billion in 2023. The space business segment’s contribution to the company’s total revenue fell to 21.9% in 2025 compared to 27.1% in 2024 even though the revenue for that segment grew by 7.6% year-on-year to $4.1 billion in 2025. Likewise, the AI segment produced a revenue of $3.2 billion, which translates to 17.1% of the 2025 total revenue (2024: $2.6 billion or 18.7% of total revenue).
In spite of revenue increases, SPACEX has found it difficult to consistently make a positive or adequate operating profit. R&D expenses have soared over the past year, hurting the company’s profitability. R&D expenses rose by 149.5% to $8.6 billion in 2025 compared to $3.5 billion in 2024. Consequently, the company posted an operating loss of $2.6 billion in 2025 (2024: $466 million operating profit, 2023: $3.5 billion operating loss). The AI segment is responsible for the operating loss. The AI segment had an operating loss of $6.4 billion in 2025 compared to $1.6 billion operating loss in the previous year. The space segment had an operating loss of $657 million in the 2025 fiscal year. By contrast, the operating profit from the connectivity segment has been increasing. In 2025, the connectivity segment recorded a $4.4 billion operating profit compared to a $2 billion profit in the year before. That was a massive jump of 120.5% in one year.
In 2025, there was a Loss Before Tax of $4.2 billion and a Loss After Tax of $4.9 billion. The company carries a huge deficit on its balance sheet owing to recurring losses. Accumulated deficit stood at $37 billion (2024: $32.1 billion). This has eroded shareholders’ equity with total equity being a meagre $2.6 billion at the end of 2025 even though the company has raised additional capital. The extra capital injected into the business was $76.5 billion at the 2025 year-end. Part of the extra capital ($38.8 billion) can be converted to equity, which can erode shareholding going forward. However, SPACEX grew its assets by 61.4% year-on-year to $92.1 billion in 2025.
Business Risk
SPACEX is at the forefront of space and scientific research. It is exploring other planets to set up data centres in space and help humans to inhabit other planets apart from the earth. Space technology is expensive and unpredictable. The technologies are futuristic and spending on them may hurt the profitability of the business. Besides, the company has not been profitable because the losses from its space and AI business segments have been cancelling out the profits made by its connectivity segment. In addition, the company is too dependent on the US; the US accounts for about 70% of its revenue.
Recommendation: Overpriced
| ($ in Million) | 2025 | 2024 | 2023 | 2022 | 2021 |
| Turnover | 18,674 | 14,015 | 10,387 | ||
| Year-on-Year Change | 33.2% | 34.9% | |||
| Operating Profit | -2,589 | 466 | -3,505 | ||
| Year-on-Year Change | -655.6% | -113.3% | |||
| EBITDA | 4,112 | 4,290 | -870 | ||
| Year-on-Year Change | -4.2% | -593.1% | |||
| PBT | -4,219 | 242 | -4,991 | ||
| Year-on-Year Change | -1,843.4% | -104.9% | |||
| PAT | -4,937 | 791 | -4,628 | ||
| Year-on-Year Change | -724.2% | -117.1% | |||
| Total Assets | 92,079 | 57,062 | |||
| Year-on-Year Change | 61.4% | ||||
| Net Current Assets | 9,552 | 4,317 | |||
| Year-on-Year Change | 121.3% | ||||
| Total Equity | 2,573 | 4,863 | |||
| Year-on-Year Change | -47.1% | ||||
| Capital Expenditure | 20,737 | 11,163 | 4,415 | ||
| Year-on-Year Change | 85.8% | 152.8% | |||
| Funds from Operations | 6,785 | 5,776 | 4,520 | ||
| Year-on-Year Change | 17.5% | 27.8% | |||
| Free Operating Cashflow | -13,952 | -5,387 | 105 | ||
| Year-on-Year Change | 159.0% | -5,230.5% | |||
| Total Debt | 22,896 | 13,793 | |||
| Year-on-Year Change | 66.0% | ||||
| Net Debt | -1,851 | 2,408 | |||
| Year-on-Year Change | –176.9% | ||||
| Shares Outstanding-ordinary shares (Million) | |||||
| Year-on-Year Change | |||||
| Payout Ratio |
| ⇑ – Year-on-Year Increase | Green: ‘Improved’ |
| ⇓ – Year-on-Year Decrease | Red: ‘Worsened’ |
| ⇔ – Year-on-Year Unchanged |
| 2025 | 2024 | 2023 | 2022 | 2021 | |
| CAPITAL STRUCTURE | |||||
| Total Debt/(Total Debt + Equity) | 89.9%%⇑ | 73.9% | |||
| Net Debt/Equity | -71.9%⇓ | 49.5% | |||
| Debt/Total Assets | 24.9%⇑ | 24.2% | |||
| Long Term Debt/Net Earnings | -5.3x⇓ | 33.6x | |||
| Current Ratio | 1.5x⇑ | 1.4x | |||
| Acid Test Ratio | 1.3x⇑ | 1.2x | |||
| CASHFLOW RATIOS | |||||
| Funds from Operations/Total Debt | 0.3x⇓ | 0.4x | |||
| Funds from Operations/Net Debt | -3.7x⇓ | 2.4x | |||
| EBITDA/Interest | 2.1x⇓ | 2.7x⇑ | -0.5x | ||
| EBIT/Interest | -1.3x⇓ | 0.3x⇑ | -2.1x | ||
| Net Debt/EBITDA | -0.5x⇓ | 0.6x | |||
| Free Operating Cashflow/Interest | -7.2x⇓ | -3.4x⇓ | 0.1x | ||
| Free Operating Cashflow/Net Debt | 7.5x⇑ | -2.2x | |||
| Free Operating Cashflow/Sales | -0.8x⇓ | -0.4x⇓ | 0.0x | ||
| PROFITABILITY RATIOS | |||||
| Gross Profit Margin | 49.4%⇑ | 43.0%⇑ | 41.2% | ||
| EBITDA Margin | 22.0%⇓ | 30.6%⇑ | -8.4% | ||
| EBIT Margin | -13.9%⇓ | 3.3%⇑ | -33.7% | ||
| PBT Margin | -22.6%⇓ | 1.7%⇑ | -48.1% | ||
| PAT Margin | -26.4%⇓ | 5.6%⇑ | -44.6% | ||
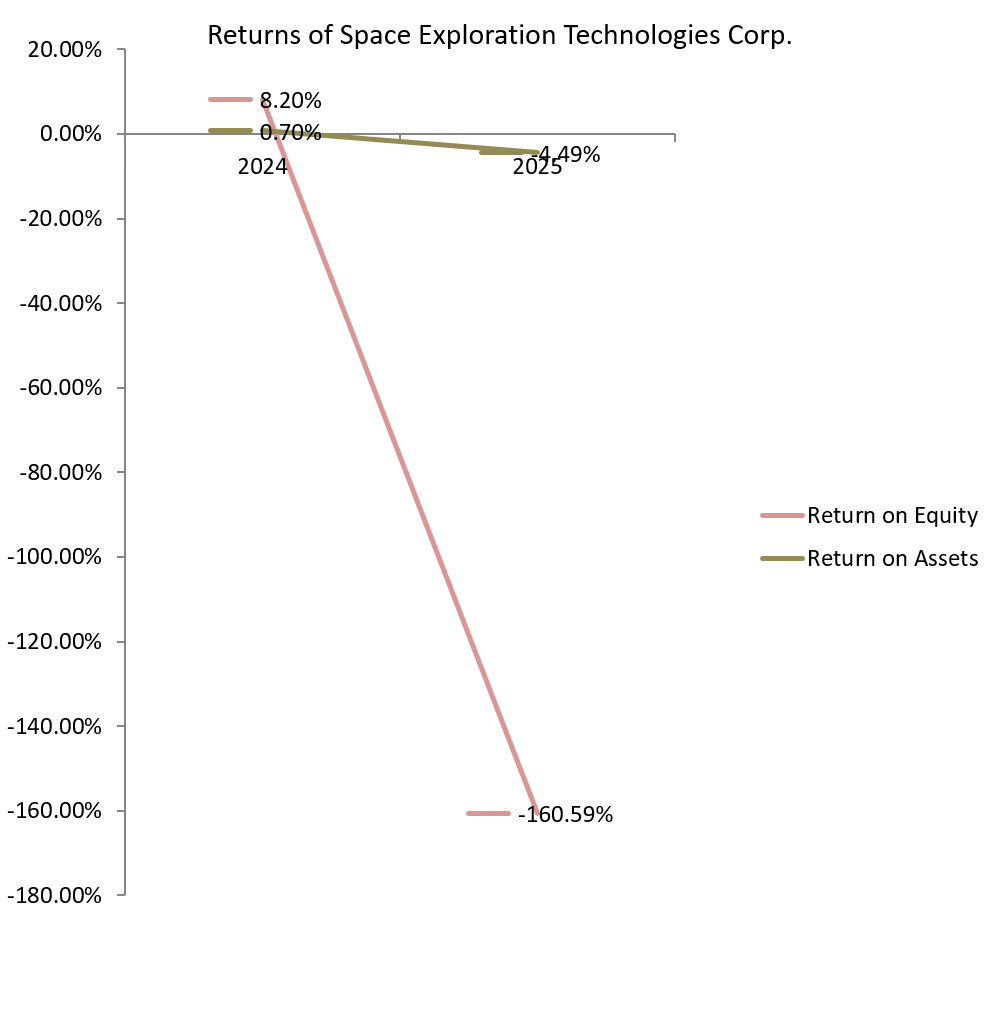
| ROAE | -111.1%⇓ | 16.4% | |||
| ROAA | -5.5%⇓ | 1.4% |