| Ticker: RIVN | Nature of Business: Technology Services | Location: USA |
| Recent Price: $12.06 | 52-Week High/Low: $17.15/ 9.50 | Estimated Fair Value: $10.80-$15.10 |
| Expected Return: 74.1% | Consider Buy: Below $15.10 | Business Risk: High |
| Financial Risk: High | Economic Moat: Weak | Corporate Governance: Strong |
Company Overview
Rivian Automotive Inc. (RIVIAN), an American electric vehicle maker, was established by Robert J. Scaringe in 2009 for the purpose of manufacturing electric vehicles. The company was later incorporated in Delaware (March 2015). RIVIAN develops and manufactures consumer and commercial electric vehicles. The shares of the company are traded on NASDAQ.
Being an integrated company, RIVIAN is involved in many stages in the electric vehicle ecosystem value chain from components manufacturing to the provision of value-added services such as vehicle repair and maintenance, charging, software subscriptions, financing, and insurance. This should improve its cost effectiveness and competitiveness going forward.
RIVIAN leverages partnerships to help improve sales volume and broaden its product portfolio. One of such collaborations is the joint venture with Volkswagen Group named Rivian and VW Group Technology, LLC. The Volkswagen Group is expected to invest a total of $5.8 billion in RIVIAN for the development of software-defined vehicle (SDV) platforms to be used in both companies’ future electric vehicles.
Robert Scaringe, the founder, is the chief executive officer of RIVIAN. He is also the chairman of the eight-man board of directors of the company.
Investment Thesis
RIVIAN, which could only deliver 920 vehicles in 2021, was able to deliver over 50,000 vehicles in 2024. Consequently, its revenue expanded by 348.7% on a 3-Year Compound Annual Growth Rate (CAGR) basis. This success is not just about its advanced technology capability; it is also about the company’s devotion to reducing carbon emissions. Its battery packs can be recycled or used for other purposes. In addition, RIVIAN does not use materials from animals in the interior parts of its vehicles.
Productive capacity is also being increased significantly, thereby improving its ability to keep up with demand. New models of its vehicles are expected to be produced in the medium term. RIVIAN received $1 billion investment from the Volkswagen Group in June 2025 to help boost its electric vehicle platforms and product portfolio. Under the agreement, Volkswagen Group will invest up to $5.8 billion by 2027. This investment will cement RIVIAN’s position in the market.
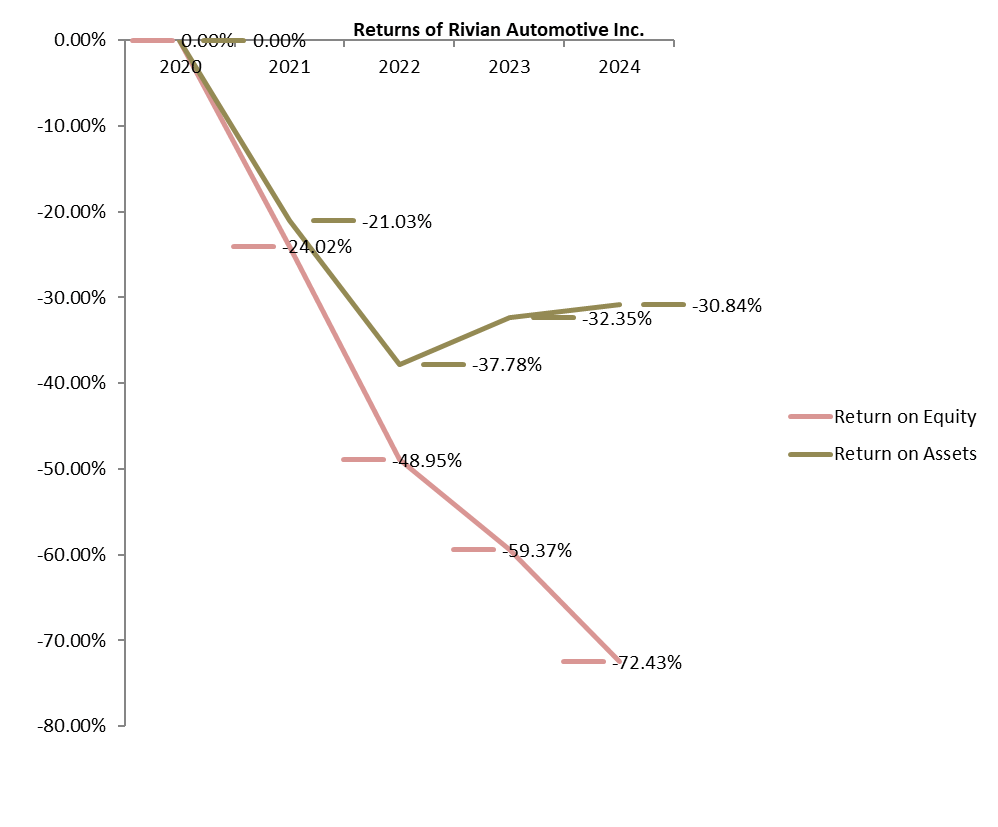
RIVIAN is not a profitable company at the moment. Shareholders’ equity is being eroded by recurring losses in spite of obtaining additional capital. Its high capital expenditure and Research and Development expense (R & D) would increase its debt and the associated obligations. The company does not pay dividends; it intends to always retain its profit, if any, to grow its business.
Valuation
A share of RIVIAN is worth between $10.80 and US$15.10, based on our estimation. We are of the opinion that investors should pay below $15.10 for a share of the company.
Financial Overview
RIVIAN declared a total revenue of $5 billion for the 2024 fiscal year, up by 12.1% year-on-year. Automobile sales produced $4.5 billion revenue in 2024 compared to the preceding year’s $4.1 billion. Automobile sales were 90.3% of total sales compared to 93.2% in the prior year (2023). Software and services, which accounted for 9.7% of total revenue, jumped by 60.3% in 2024 to $484 million.
The cost of sales has been exceeding total revenue, thereby resulting in gross loss over the years. However, the gross loss has been decreasing as the company raises output to reduce unit cost. The company posted a gross loss of $1.2 billion in 2024 (2023:$2 billion, 2022:$3.1 billion). The bulk of the gross loss is from vehicle sales. In fact, the software and services business segment has started making gross profit (2024: $7 million) even though the gross profit margin was less than 2%. Loss from operations shed 18.3% year-on-year to -$4.7 billion in 2024 compared to a 16.3% drop in the earlier year. A 19.2% decrease in R & D expense was responsible for the reduction in operating loss in the 2024 fiscal year. RIVIAN declared a loss after tax of $4.7 billion, down by 12.6% from the year before.
Total assets which stood at $15.4 billion lost 8.5% year-on year owing to a fall in inventory, and cash and cash equivalents. RIVIAN’s accumulated deficit reached $23.3 billion owing losses it has been accumulating since inception. Consequently, shareholders’ equity has been declining in spite of additional capital injection into the business. Shareholders’ equity was $6.6 billion in 2024 compared to $19.5 billion at the end of 2021.
RIVIAN is sitting on a large cash pile – cash and cash equivalents exceeded $5 billion in 2024. The company does not generate a positive operating cash or free cash flow for the shareholders. Debt has risen at a compound annual rate of 44.2% over the past three years. There is neither operating profit nor operating cash flow to pay the interest on its debt.
Business Risk
Huge costs threaten the profitability and survival of RIVIAN. It may find it difficult to raise its prices to cover its costs in the light of the increasing competition in the electric vehicle market. But sales volume has to increase in order to enjoy lower unit cost and become profitable.
Recommendation: Hold

| (US$ in Million) | 2024 | 2023 | 2022 | 2021 |
| Turnover | 4,970 | 4,434 | 1,658 | 55 |
| Year-on-Year Change | 12.1% | 167.4% | 2,914.6% | N/A |
| Operating Profit | -4,689 | -5,739 | -6,856 | -4,220 |
| Year-on-Year Change | -18.3% | -16.3% | 62.5% | 313.3% |
| EBITDA | -3,658 | -4,802 | -6,204 | -4,023 |
| Year-on-Year Change | -23.8% | -22.6% | 54.2% | 305.5% |
| PBT | -4,741 | -5,431 | -6,748 | -4,688 |
| Year-on-Year Change | -12.7% | -19.5% | 43.9% | 360.5% |
| PAT | -4,746 | -5,432 | -6,752 | -4,688 |
| Year-on-Year Change | -12.6% | -19.6% | 44.0% | 360.5% |
| Total Assets | 15,410 | 16,778 | 17,876 | 22,294 |
| Year-on-Year Change | -8.2% | -6.1% | -19.8% | N/A |
| Net Current Assets | 8,332 | 9,826 | 10,706 | 17,246 |
| Year-on-Year Change | -15.2% | -8.2% | -37.9% | N/A |
| Total Equity | 6,562 | 9,141 | 13,799 | 19,514 |
| Year-on-Year Change | -28.2% | -33.8% | -29.3% | N/A |
| Capital Expenditure | 1,141 | 1,026 | 1,369 | 1,794 |
| Year-on-Year Change | 11.2% | -25.1% | -23.7% | 96.3% |
| Funds from Operations | -1,716 | -4,866 | -5,052 | -2,622 |
| Year-on-Year Change | -64.7% | -3.7% | 92.7% | 209.2% |
| Free Operating Cashflow | -2,857 | -5,892 | -6,421 | -4,416 |
| Year-on-Year Change | -51.5% | -8.2% | 45.4% | 150.6% |
| Total Debt | 4,820 | 4,775 | 1,812 | 1,607 |
| Year-on-Year Change | 1.4% | 162.4% | 12.8% | N/A |
| Net Debt | -474 | -3,102 | -9,756 | -16,526 |
| Year-on-Year Change | -84.7% | -68.2% | -41.0% | N/A |
| Shares Outstanding (Million) | 1,013 | 947 | 913 | 204 |
| Year-on-Year Change | 7.0% | 3.7% | 347.6% | 102.0% |
| Payout Ratio | 0.0% | 0.0% | 0.0% | 0.0% |
| ⇑ – Year-on-Year Increase | Green: ‘Improved’ |
| ⇓ – Year-on-Year Decrease | Red: ‘Worsened’ |
| ⇔ – Year-on-Year Unchanged |
| 2024 | 2023 | 2022 | 2021 | |
| CAPITAL STRUCTURE | ||||
| Total Debt/(Total Debt + Equity) | ||||
| Net Debt/Equity | ||||
| Debt/Total Assets | ||||
| Long Term Debt/Net Earnings | ||||
| Current Ratio | ||||
| Acid Test Ratio | ||||
| CASHFLOW RATIOS | ||||
| Funds from Operations/Total Debt | ||||
| Funds from Operations/Net Debt | ||||
| EBITDA/Interest | ||||
| EBIT/Interest | ||||
| Net Debt/EBITDA | ||||
| Free Operating Cashflow/Interest | ||||
| Free Operating Cashflow/Net Debt | ||||
| Free Operating Cashflow/Sales | ||||
| PROFITABILITY RATIOS | ||||
| Gross Profit Margin | ||||
| EBITDA Margin | ||||
| EBIT Margin | ||||
| PBT Margin | ||||
| PAT Margin | ||||
| ROAE | ||||
| ROAA |