| Ticker: 2015 | Nature of Business: Technology | Location: China |
| Recent Price: HK$100.50 | 52-Week High/Low: HK$138.30/69.05 | Estimated Fair Value: HK$82.36-HK$104.05 |
| Expected Return: 39% | Consider Buy: Below HK$104.05 | Business Risk: High |
| Financial Risk: High | Economic Moat: Weak | Corporate Governance: Strong |
Company Overview
Li Auto Inc. (LI AUTO) was incorporated in Cayman Islands, a British Overseas Territory. It is a holding company that carries out most of its business through subsidiaries and variable interest entities in China. Its shares are listed on the Hong Kong Stock Exchange. The company has American Depositary Shares which are on the NASDAQ Stock Market.
Though it was established in 2015, LI AUTO started electric vehicles production in November 2019. It produces premium electric vehicles such as extended-range electric passenger vehicles and battery electric passenger vehicles.
The oversight function of the board of directors is handled by eight directors comprising three executive directors and five non-executive directors. Xiang Li, the founder, is the chairman and chief executive officer of the company. Donghui Ma, an executive director, serves as the company’s president while another executive director, Tie Li, doubles as chief financial officer.
Investment Thesis
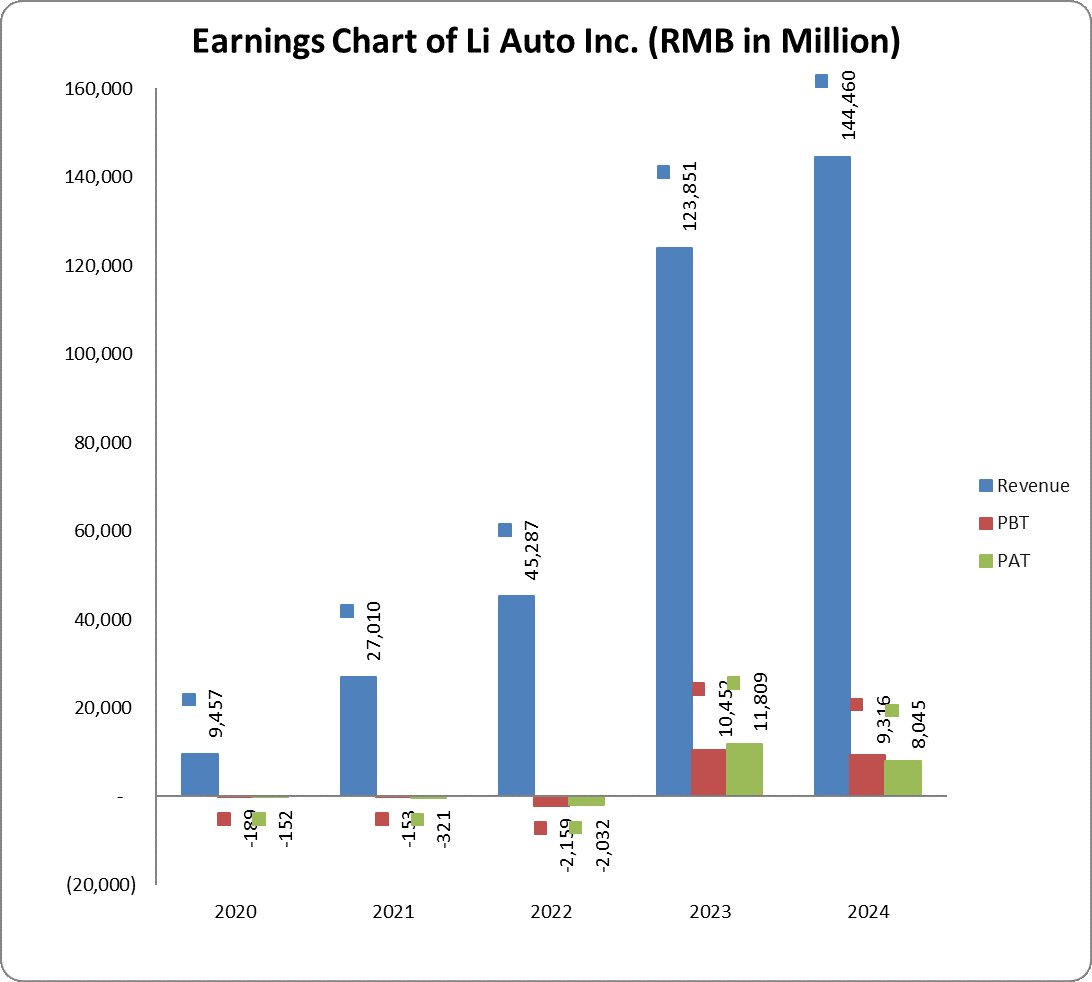
LI AUTO has taken advantage of its expertise in producing extended-range electric vehicles to grow its top-line and bottom-line. Over the past five years, revenue has grown at a compound annual rate of 247.7%. In addition, gross profit has risen dramatically in the last five years. In 2020, LI AUTO declared a gross profit of just RMB1.5 billion but it skyrocketed to RMB29.7 billion in 2024.
The company has not been trapped in debt despite the fact that the business requires a lot of spending on capital, and research and development. Operating cash flow has been positive and it can pay the interest expense many times over. The company which could not produce any profit from operation between 2019 and 2022 to cover interest, now generates enough profit to offset interests. In 2024, operating profit covered interest payment 37.4 times.
The company has focused on the Chinese market since it began operations. And with the increasing competition in the new energy vehicles market both in China and beyond, it has to explore foreign markets to help bring down the unit cost of its vehicles through large scale production. Total costs are high resulting in low profit margins. Total cost, on average, have surpassed total revenue in the past five years. In addition, LI AUTO may have to widen its product portfolio and adapt its electric vehicles to suit other countries.
The performance of LI AUTO in the last five years has been relatively encouraging. There has been a significant rise in sales since it started producing its first model of electric vehicle in 2019. Though it does not pay dividends, the company seems to be positioning itself to create value for the shareholders. Investors should only buy the shares of LI AUTO when it is trading at a discount from its fair value estimate.
Valuation
The estimated fair value of a share of LI AUTO is between RMB75.48 (HK$82.36) and RMB95.36 (HK$104.05).
Financial Overview
LI AUTO’s revenue jumped 16.6% from RMB123.9 billion in 2023 to RMB144.5 billion in 2024. Gross profit gained 7.9% year-on-year compared to the previous year when it rose by 212.8%. Gross profit margin, however, lost 1.7% to close at 20.5% for the 2024 fiscal year. The company posted an operating profit for the second time since inception; it made an operating profit of RMB7 billion in 2024 compared to RMB7.4 billion in 2023. Operating profit was 4.9% of revenue in 2024 compared to 6% in the prior year. Nevertheless, they were better than the 5-year average operating profit margin of -1.6%.
Total costs have always surpassed revenue except in 2023 and 2024 when it was 94% and 95.1% of revenue respectively. Cost of sales, which has been rising, accounts for about 80% of total revenue. Both Profit Before Tax (PBT) and Profit After Tax (PAT) were positive for two straight years. PBT was RMB9.3 billion in 2024 compared to RMB10.5 billion in prior year. The PBT declared amounted to 6.5% of revenue in 2024 and 8.4% of 2023’s revenue. PAT shed 31.9% year-on-year to RMB8 billion. PAT margin shrank by 4 percentage points in 2024 from 9.5% achieved a year ago.
LI AUTO’s debts have been rising; howbeit, they are at a manageable level for the business. Total debts stood at RMB16.3 billion at 2024 year end, a year-on-year increase of 20.7%. Total debts stood at 10.1% of total assets and 22.9% of shareholders’ fund. The company sits on tons of cash. Cash and cash equivalents totalled RMB65.9 billion or 40.6% of total assets at the end of 2024 (2023: RMB91.3 billion or 63.7% of total assets). The company has also been producing free cash flow in spite of the rising capital expenditure.
Business Risk
LI AUTO is limited to providing Chinese families with extended-range and battery electric passenger vehicles. The Chinese automotive industry is becoming increasingly competitive. In addition, the company’s product portfolio is narrow and it focuses on premium electric vehicles market at the moment. This may make it difficult to achieve the sales volume required to reduce its costs and increase profitability going forward.
Recommendation: Hold
| (RMB in Million) | 2024 | 2023 | 2022 | 2021 | 2020 |
| Turnover | 144,460 | 123,851 | 45,287 | 27,010 | 9,457 |
| Year-on-Year Change | 16.6% | 173.5% | 67.7% | 185.6% | 3,225.5% |
| Operating Profit | 7,019 | 7,407 | -3,655 | -1,017 | -669 |
| Year-on-Year Change | -5.2% | -302.7% | 259.3% | 52.0% | -64.0% |
| EBITDA | 10,077 | 9,212 | -2,441 | -427 | -348 |
| Year-on-Year Change | 9.4% | -477.4% | 471.8% | 22.6% | -80.0% |
| PBT | 9,316 | 10,452 | -2,159 | -153 | -189 |
| Year-on-Year Change | -10.9% | -584.0% | 1,313.1% | -19.1% | -92.2% |
| PAT | 8,045 | 11,809 | -2,032 | -321 | -152 |
| Year-on-Year Change | -31.9% | -681.1% | 532.2% | 112.0% | -93.8% |
| Total Assets | 162,349 | 143,467 | 86,538 | 61,849 | 36,373 |
| Year-on-Year Change | 13.2% | 65.8% | 39.9% | 70.0% | 282.3% |
| Net Current Assets | 57,094 | 41,783 | 39,620 | 40,272 | 27,082 |
| Year-on-Year Change | 36.6% | 5.5% | -1.6% | 48.7% | 6,913.9% |
| Total Equity | 71,320 | 60,575 | 45,186 | 41,064 | 29,804 |
| Year-on-Year Change | 17.7% | 34.1% | 10.0% | 37.8% | -625.2% |
| Capital Expenditure | 7,730 | 6,507 | 5,130 | 4,075 | 711 |
| Year-on-Year Change | 18.8% | 26.9% | 25.9% | 473.5% | –53.0% |
| Funds from Operations | 15,933 | 50,694 | 7,380 | 8,340 | 3,140 |
| Year-on-Year Change | -68.6% | 586.9% | -11.5% | 165.6% | -275.1% |
| Free Operating Cashflow | 8,203 | 44,186 | 2,250 | 4,265 | 2,429 |
| Year-on-Year Change | -81.4% | 1,863.6% | -47.2% | 75.6% | -173.5% |
| Total Debt | 16,345 | 13,547 | 12,264 | 7,841 | 2,114 |
| Year-on-Year Change | 20.7% | 10.5% | 56.4% | 270.9% | 23.6% |
| Net Debt | -49,556 | -77,782 | -26,214 | -20,013 | -6,824 |
| Year-on-Year Change | -36.3% | 196.7% | 31.0% | 193.3% | -1,745.6% |
| Shares Outstanding (Million) | 1,993 | 1,968 | 1,941 | 1,853 | 870 |
| Year-on-Year Change | 1.3% | 1.4% | 4.7% | 113.0% | 241.2% |
| Payout Ratio | 0.0% | 0.0% | 0.0% | 0.0% | 0.0% |
| ⇑ – Year-on-Year Increase | Green: ‘Improved’ |
| ⇓ – Year-on-Year Decrease | Red: ‘Worsened’ |
| ⇔ – Year-on-Year Unchanged |
| 2024 | 2023 | 2022 | 2021 | 2020 | |
| CAPITAL STRUCTURE | |||||
| Total Debt/(Total Debt + Equity) | 18.6%⇑ | 18.3%⇓ | 21.4%⇑ | 16.0%⇑ | 6.6%⇑ |
| Net Debt/Equity | -69.5%⇑ | -128.4%⇓ | -58.0%⇓ | -48.7%⇓ | -22.9%⇓ |
| Debt/Total Assets | 10.1%⇑ | 9.4%⇓ | 14.2%⇑ | 12.7%⇑ | 5.8%⇓ |
| Long Term Debt/Net Earnings | 1.8x⇓ | 0.5x⇑ | -16.3x⇓ | -8.8x⇓ | -1.1x⇓ |
| Current Ratio | 1.8x⇑ | 1.6x⇓ | 2.5x⇓ | 4.3x⇓ | 7.3x⇑ |
| Acid Test Ratio | 1.7x⇑ | 1.5x⇓ | 2.2x⇓ | 4.2x⇓ | 7.0x⇑ |
| CASHFLOW RATIOS | |||||
| Funds from Operations/Total Debt | 1.0x⇓ | 3.7x⇑ | 0.6x⇓ | 1.1x⇓ | 1.5x⇑ |
| Funds from Operations/Net Debt | -0.3x⇑ | -0.7x⇓ | -0.3x⇑ | -0.4x⇑ | -0.5x⇑ |
| EBITDA/Interest | 53.7x⇓ | 106.8x⇑ | -23.0x⇓ | -6.8x⇓ | -5.2x⇑ |
| EBIT/Interest | 37.4x⇓ | 85.9x⇑ | -34.4x⇓ | -16.1x⇓ | -10.0x⇑ |
| Net Debt/EBITDA | -4.9x⇑ | -8.4x⇓ | 10.7x⇓ | 46.9x⇑ | 19.6x⇑ |
| Free Operating Cashflow/Interest | 43.7x⇓ | 512.3x⇑ | 21.2x⇓ | 67.4x⇑ | 36.3x⇑ |
| Free Operating Cashflow/Net Debt | -0.2x⇑ | -0.6x⇓ | -0.1x⇑ | -0.2x⇑ | -0.4x⇑ |
| Free Operating Cashflow/Sales | 0.1x⇓ | 0.4x⇑ | 0.1x⇓ | 0.2x⇓ | 0.3x⇑ |
| PROFITABILITY RATIOS | |||||
| Gross Profit Margin | 20.5%⇓ | 22.2%⇑ | 19.4%⇓ | 21.3%⇑ | 16.4%⇑ |
| EBITDA Margin | 7.0%⇓ | 7.4%⇑ | -5.4%⇓ | -1.6%⇑ | -3.7%⇑ |
| EBIT Margin | 4.9%⇓ | 6.0%⇑ | -8.1%⇓ | -3.8%⇑ | -7.1%⇑ |
| PBT Margin | 6.5%⇓ | 8.4%⇑ | -4.8%⇓ | -0.6%⇑ | -2.0%⇑ |
| PAT Margin | 5.6%⇓ | 9.5%⇑ | -4.5%⇓ | -1.2%⇑ | -1.6%⇑ |
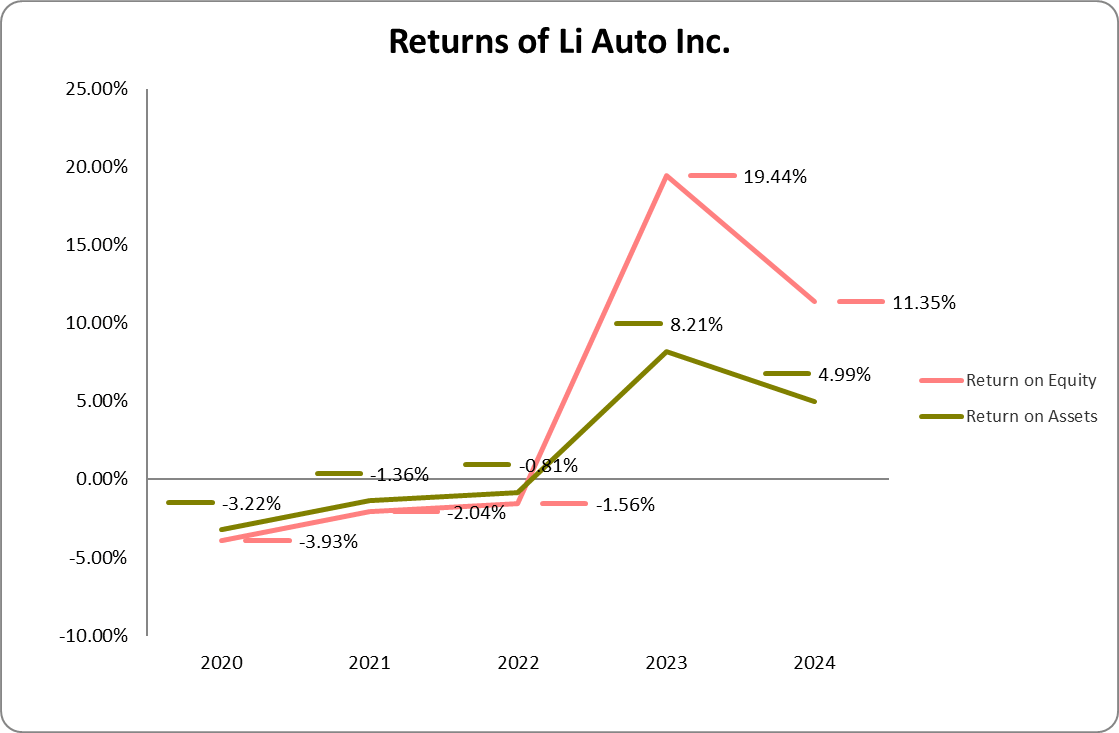
| ROAE | 12.3%⇓ | 22.3%⇑ | -1.6%⇑ | -2.4%⇑ | -9.7%⇓ |
| ROAA | 5.3%⇓ | 10.2%⇑ | -1.0%⇑ | -1.7%⇑ | -5.1%⇑ |