| Ticker: 1211 | Nature of Business: Technology | Location: China |
| Recent Price: HK$129.600 | 52-Week High/Low: HK$159.267/67.600 | Estimated Fair Value: HK$178.570-HK$188.900 |
| Expected Return: 36.2% | Consider Buy: Below HK$183.735 | Business Risk: High |
| Financial Risk: Medium | Economic Moat: Weak | Corporate Governance: Strong |
Company Overview
BYD Company Limited (BYD) is a Chinese technology company that specialises in the production of rechargeable batteries, electric cars and hybrid cars. It started as Shenzhen BYD Battery Company Limited in February 1995; at the time, the company was involved in the manufacture and sale of rechargeable batteries used in mobile phones and portable electronic devices. Its name was changed to BYD Company Limited in June 2002 and its shares were listed on the Hong Kong Stock Exchange in July 2002. BYD listed its shares on the Shenzhen Stock Exchange in June 2011.
BYD ventured into car production after its acquisition of Xian Qin Chuan Automobile Limited, which it renamed BYD Automobile Company Limited in 2003. The company stopped the production of fuel-engine vehicles in 2022 in favour of new energy vehicles (electric and hybrid electric vehicles). Presently, automobiles and related products account for about 80% of the company’s revenue.
Innovation engendered by continuous spending on Research and Development (R&D) has enabled the company to meet the demand for new technologies such as electric vehicles. It has invested RMB126.9 billion on R&D in the past five years. BYD has been penetrating markets outside China in a bid to boost the sale of its new energy solutions. Its new energy vehicles are now being sold in over 100 countries and regions. It is also setting up its facilities in foreign markets such as Hungary and Brazil.
Wang Chuan-fu, the company’s founder, is the chairman, executive director and president. Mr. Wang, who oversees the company’s operations, is assisted by two non-executive directors and three independent non-executive directors. Mr. Lv Xiang-yang, a co-founder, is the vice chairman and non-executive director of BYD.
Investment Thesis
BYD has been producing rechargeable batteries for about three decades; it has been producing cars for about two decades. It is in a favourable position to take advantage of opportunities in sustainable energy solutions, having honed its R&D capability over a period of three decades.
There has been a high demand for its products both within and outside China. The company has benefitted from mobile communications growth which drives demand for rechargeable batteries, and rising demand for sustainable energy products. BYD is expanding its capacity outside China and intensifying its efforts at reaching foreign markets with its products. Over the past three years, BYD’s operating revenue grew at a Compound Annual Growth Rate (CAGR) of 53.2%. In 2024, the revenue from automobiles and related products, and other products business segment was RMB617.1 billion, representing a year-on-year growth of 27.7%. The handset components, assembly service and other products division posted a RMB159.6 billion revenue which was 34.6% higher than the prior year’s figure. Revenue from outside China has increased at an average of 48.7% per annum in the past ten years while the yearly revenue growth in China averaged 32.1%.
On the contrary, BYD’s huge cost of sales has been a major factor responsible for low profit margins. Both Operating profit margin and Profit Before Tax (PBT) margins evened out to 4.7% in the past ten years while Profit After Tax (PAT ) margin averaged 3.9%. We expect the average cost to drop as the company continues to expand its capacity.
We are of the belief that better working capital management would prevent the company from running into choppy waters. However, we do not have any reason to believe that its long-term solvency is impaired.
BYD is generating a lot of cash and rewarding shareholders with dividends even though the business spends a lot of money on capital expenditure. Currently, it trades below our fair value estimate. Expected return on a share of the company is 36.2%, comprising dividend yield and capital appreciation.
Valuation
BYD should trade between RMB162.74 (HK178.570) and RMB172.16 (HK$188.900) based on our valuation.
Financial Overview
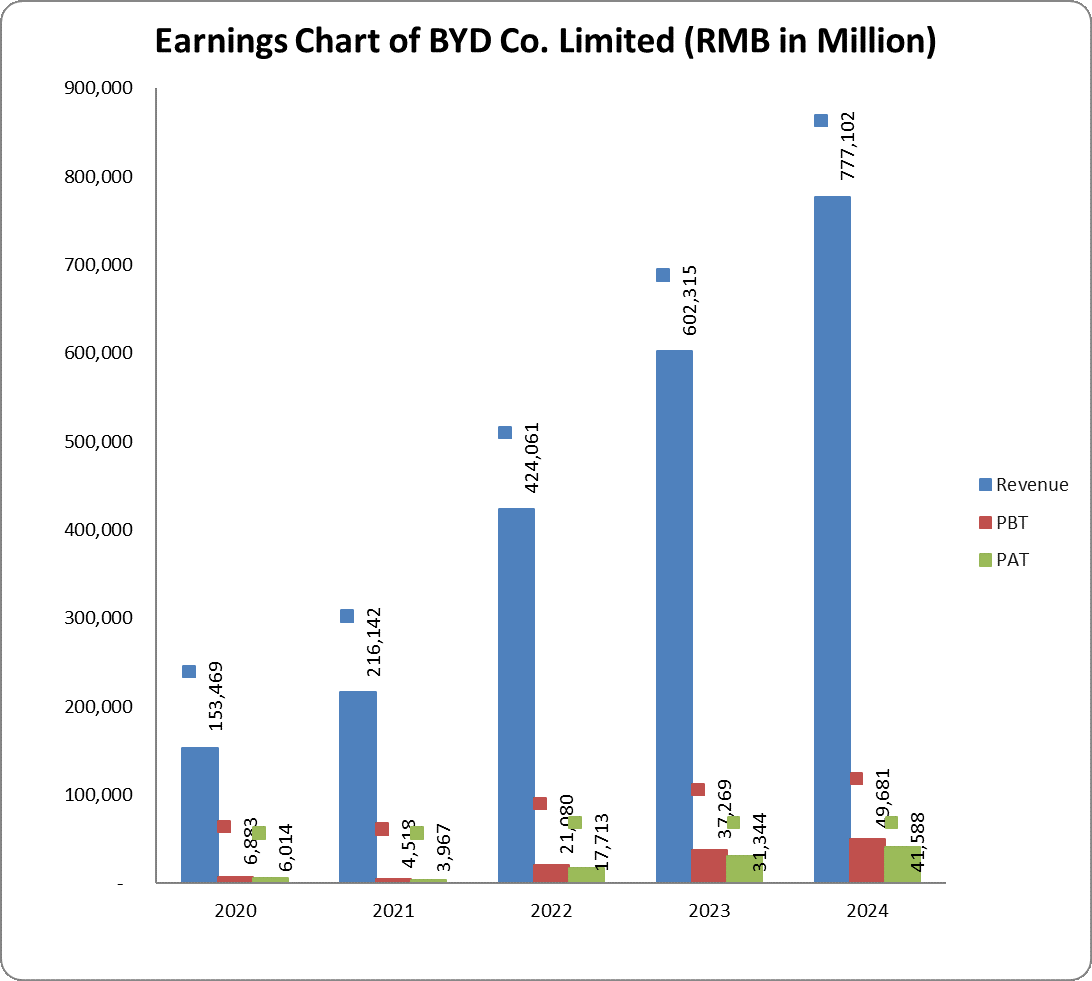
BYD’s operating revenue in 2024 was RMB777.1 billion, up by 29% from the preceding year’s revenue of RMB602.3 billion. Countries outside China have produced 35.3% of the revenue increment in 2024 compared to 38.6% in the prior year. In fact, BYD more than doubled its revenue from outside China in two years. It includes sales to Hong Kong, Macau and Taiwan as part of China’s sales.
RMB617.1 billion or 79.4% of total operating revenue was realised from the automobiles and related products and other products in the year under review (2023: RMB483.3 billion or 80.2% of total operating revenue). Handset components, assembling service and other products accounted for 20.5% of operating revenue in 2024 (2023: 19.7%).
The gross profit of the company rose by 35% year-on-year to RMB151.1 billion in spite of a 27.7% hike in cost of sales. Gross profit margin has hovered around 16.7% over the past ten years owing to a high cost of sales. In the last ten years, the cost of sales to turnover ratio averaged 83.3%. Consequently, profit margins have not been high. Operating, PBT and PAT have all risen for three consecutive years; they had a year-on-year increase of 21.8%, 33.3% and 32.7% respectively in 2024.
BYD has been consistently growing both its total assets and shareholders’ fund. Total assets reached a peak of RMB783.4 billion at the end of the 2024 fiscal year, while shareholders’ fund (total equity) has increased by 21.3% on a 10-Year CAGR basis. Current ratio averaged 0.9 while acid test ratio stood 0.7 because current liabilities have been exceeding current assets. The company is not bogged down with debts. There has been a dramatic fall in the debt-to-assets ratio and debt-to-equity ratio. In addition, the company generates adequate operating profit and operating cash flow to cover interest payments. The rise in capital expenditure over the past seven years has not prevented the company from producing free cash flow for the shareholders. In our opinion, BYD is not insolvent.
Business Risk
The industry is becoming more competitive as new and existing fuel-engine vehicles makers are venturing into alternative energy vehicles market. The market is also prone to rapid technological change; companies are required to constantly spend on R&D which has implication for profit margins.
Recommendation: Underpriced
| (RMB in Million) | 2024 | 2023 | 2022 | 2021 | 2020 |
| Turnover | 777,102 | 602,315 | 424,061 | 216,142 | 153,469 |
| Year-on-Year Change | 29.0% | 42.0% | 96.2% | 40.8% | 26.0% |
| Operating Profit | 40,379 | 33,159 | 21,255 | 5,327 | 8,271 |
| Year-on-Year Change | 21.8% | 56.0% | 299.0% | -35.6% | 126.3% |
| EBITDA | 50,669 | 39,122 | 24,587 | 7,666 | 20,787 |
| Year-on-Year Change | 29.5% | 59.1% | 220.7% | -63.1% | 54.1% |
| PBT | 49,681 | 37,269 | 21,080 | 4,518 | 6,883 |
| Year-on-Year Change | 33.3% | 76.8% | 366.6% | -34.4% | 183.1% |
| PAT | 41,588 | 31,344 | 17,713 | 3,967 | 6,014 |
| Year-on-Year Change | 32.7% | 77.0% | 346.5% | -34.0% | 183.8% |
| Total Assets | 783,356 | 679,548 | 493,861 | 295,780 | 201,017 |
| Year-on-Year Change | 15.3% | 37.6% | 67.0% | 47.1% | 2.8% |
| Net Current Assets | -125,413 | -151,545 | -92,541 | -5,194 | 5,174 |
| Year-on-Year Change | -17.2% | 63.8% | 1,681.8% | -200.4% | -587.1% |
| Total Equity | 198,688 | 150,462 | 121,390 | 104,244 | 64,454 |
| Year-on-Year Change | 32.1% | 24.0% | 16.5% | 61.7% | 3.0% |
| Capital Expenditure | 97,485 | 136,171 | 97,457 | 37,344 | 7,526 |
| Year-on-Year Change | -28.4% | 39.7% | 161.0% | 396.2% | -43.1% |
| Funds from Operations | 133,454 | 169,725 | 140,838 | 65,467 | 45,393 |
| Year-on-Year Change | -21.4% | 20.5% | 115.1% | 44.2% | 207.8% |
| Free Operating Cashflow | 35,967 | 33,554 | 43,381 | 28,123 | 37,866 |
| Year-on-Year Change | 7.2% | -22.7% | 54.3% | -25.7% | 2,408.0% |
| Total Debt | 30,237 | 39,146 | 15,364 | 22,410 | 52,282 |
| Year-on-Year Change | -22.8% | 154.8% | -31.4% | -57.1% | -31.9% |
| Net Debt | -113,013 | -79,492 | -56,734 | -33,654 | 38,544 |
| Year-on-Year Change | 42.2% | 40.1% | 68.6% | -187.3% | -40.8% |
| Shares Outstanding (Million) | 2.907 | 2,906 | 2,908 | 2,854 | 2,728 |
| Year-on-Year Change | 0.0% | -0.1% | 1.9% | 4.6% | 0.0% |
| Payout Ratio | 27.2% | 28.6% | 18.2% | 6.7% | 11.9% |
| ⇑ – Year-on-Year Increase | Green: ‘Improved’ |
| ⇓ – Year-on-Year Decrease | Red: ‘Worsened’ |
| ⇔ – Year-on-Year Unchanged |
| 2024 | 2023 | 2022 | 2021 | 2020 | |
| CAPITAL STRUCTURE | |||||
| Total Debt/(Total Debt + Equity) | 13.2%⇓ | 20.7%⇑ | 11.2%⇓ | 17.7%⇓ | 44.8%⇓ |
| Net Debt/Equity | -56.9%⇓ | -52.8%⇓ | -46.7%⇓ | -32.3%⇓ | 59.8%⇓ |
| Debt/Total Assets | 3.9%⇓ | 5.8%⇑ | 3.1%⇓ | 7.6%⇓ | 26.0%⇓ |
| Long Term Debt/Net Earnings | 0.4x⇓ | 0.7x⇑ | 0.6x⇓ | 3.5x⇓ | 6.6x⇓ |
| Current Ratio | 0.8x⇑ | 0.7x⇔ | 0.7x⇓ | 1.0x⇓ | 1.1x⇑ |
| Acid Test Ratio | 0.5x⇔ | 0.5x⇔ | 0.5x⇓ | 0.7x⇓ | 0.8x⇔ |
| CASHFLOW RATIOS | |||||
| Funds from Operations/Total Debt | 4.4x⇑ | 4.3x⇓ | 9.2x⇑ | 2.9x⇑ | 0.9x⇑ |
| Funds from Operations/Net Debt | -1.2x⇑ | -2.1x⇑ | -2.5x⇓ | -2.0x⇓ | 1.2x⇑ |
| EBITDA/Interest | 41.7x⇑ | -26.5x⇓ | -15.2x⇓ | 4.3x⇓ | 6.7x⇑ |
| EBIT/Interest | 33.2x⇑ | -22.5x⇓ | -13.1x⇓ | 3.0x⇑ | 2.7x⇑ |
| Net Debt/EBITDA | -2.2x⇓ | -2.0x⇑ | -2.3x⇑ | -4.4x⇓ | 1.9x⇓ |
| Free Operating Cashflow/Interest | 29.6x⇑ | -22.8x⇑ | -26.8x⇓ | 15.7x⇑ | 12.1x⇑ |
| Free Operating Cashflow/Net Debt | -0.3x⇑ | -0.4x⇑ | -0.8x⇔ | -0.8x⇓ | 1.0x⇑ |
| Free Operating Cashflow/Sales | 0.1x⇔ | 0.1x⇔ | 0.1x⇔ | 0.1x⇓ | 0.3x⇑ |
| PROFITABILITY RATIOS | |||||
| Gross Profit Margin | 19.4%⇑ | 18.6%⇑ | 17.0%⇑ | 13.0%⇓ | 17.8%⇑ |
| EBITDA Margin | 6.5%⇔ | 6.5%⇑ | 5.8%⇑ | 3.6%⇓ | 13.5%⇑ |
| EBIT Margin | 5.2%⇓ | 5.5%⇑ | 5.0%⇑ | 2.5%⇓ | 5.4%⇑ |
| PBT Margin | 6.4%⇑ | 6.2%⇑ | 5.0%⇑ | 2.1%⇓ | 4.5%⇑ |
| PAT Margin | 5.4%⇑ | 5.2%⇑ | 4.2%⇑ | 1.8%⇓ | 3.9%⇑ |
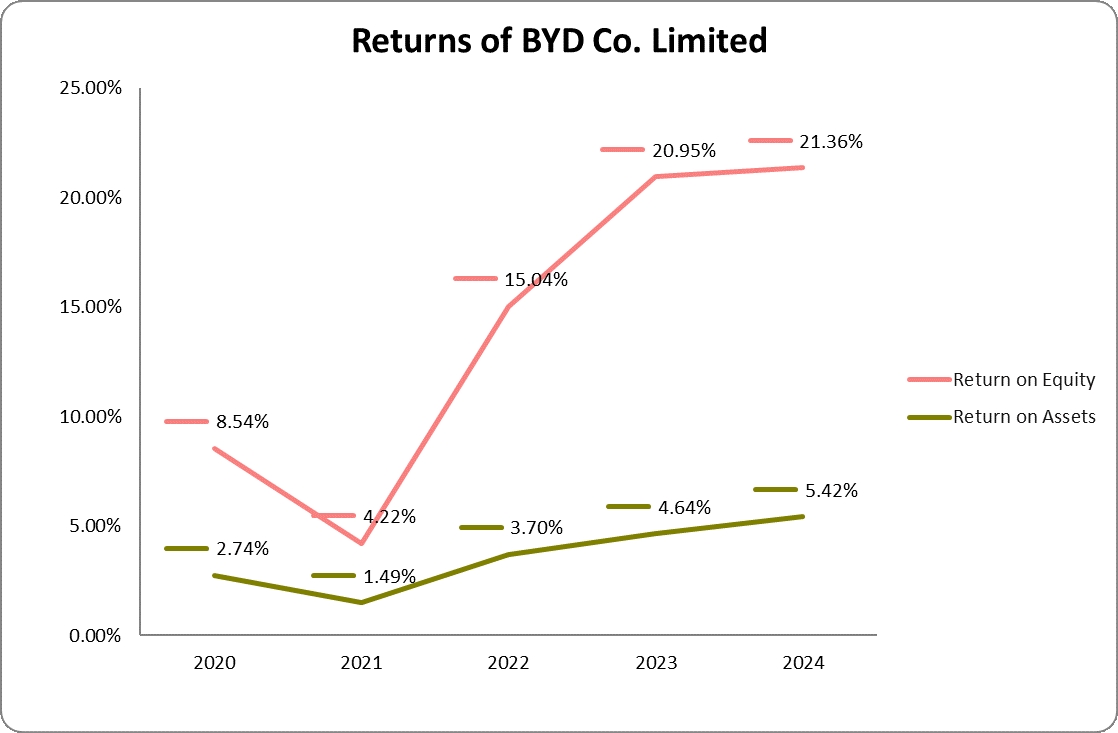
| ROAE | 24.3%⇑ | 23.2%⇑ | 16.2%⇑ | 5.2%⇓ | 8.7%⇑ |
| ROAA | 5.8%⇑ | 5.4%⇑ | 4.6%⇑ | 1.8%⇓ | 2.8%⇑ |